Lexmark 2013 Annual Report Download - page 27
Download and view the complete annual report
Please find page 27 of the 2013 Lexmark annual report below. You can navigate through the pages in the report by either clicking on the pages listed below, or by using the keyword search tool below to find specific information within the annual report.-
 1
1 -
2
-
3
-
4
-
5
-
6
-
7
-
8
-
9
-
10
-
11
-
12
-
13
-
14
-
15
-
16
-
 17
17 -
 18
18 -
 19
19 -
 20
20 -
 21
21 -
 22
22 -
 23
23 -
 24
24 -
 25
25 -
 26
26 -
 27
27 -
 28
28 -
 29
29 -
 30
30 -
 31
31 -
 32
32 -
 33
33 -
 34
34 -
 35
35 -
 36
36 -
 37
37 -
38
-
39
-
40
-
41
-
42
-
43
-
44
-
45
-
46
-
47
-
48
-
49
-
50
-
51
-
52
-
53
-
54
-
55
-
56
-
57
-
58
-
59
-
60
-
61
-
62
-
63
-
64
-
65
-
66
-
67
-
68
-
69
-
70
-
71
-
72
-
73
-
74
-
75
-
76
-
77
-
78
-
79
-
80
-
81
-
82
-
83
-
84
-
85
-
86
-
87
-
88
-
89
-
90
-
91
-
92
-
93
-
94
-
95
-
96
-
97
-
98
-
99
-
100
-
101
-
102
-
103
-
104
-
105
-
106
-
107
-
108
-
109
-
110
-
111
-
112
-
113
-
114
-
115
-
116
-
117
-
118
-
119
-
120
-
121
-
122
-
123
-
124
-
125
-
126
-
127
-
128
-
129
-
130
-
131
-
132
-
133
-
134
-
135
-
136
-
137
-
138
-
139
-
140
-
141
-
142
-
143
-
144
-
145
-
146
-
147
-
148
-
149
-
150
-
151
-
152
 |
 |
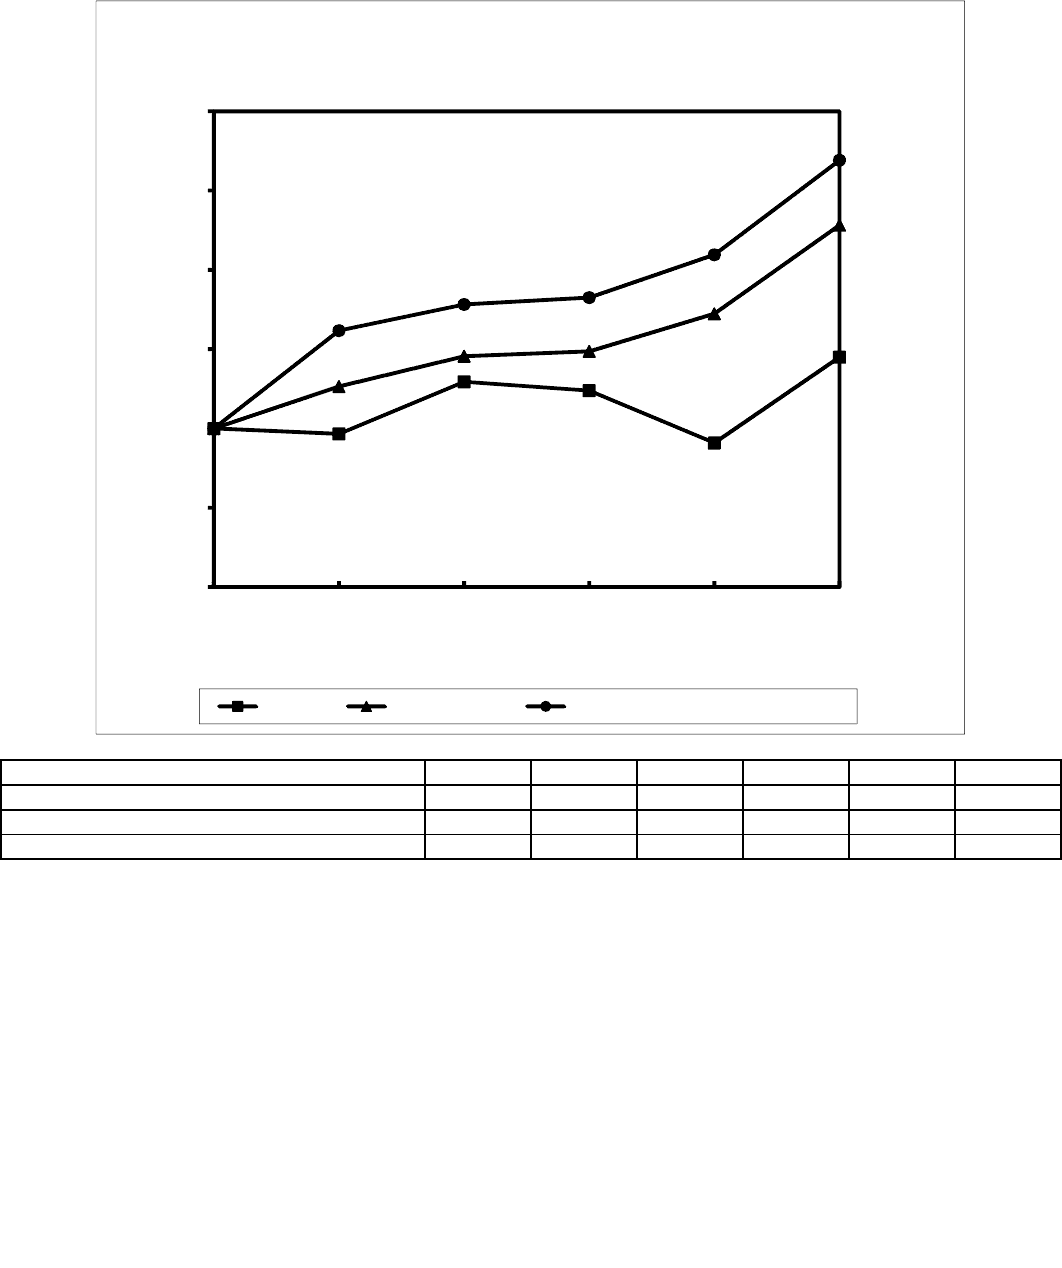
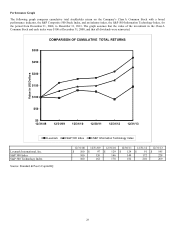
Performance Graph
The following graph compares cumulative total stockholder return on the Company’s Class A Common Stock with a broad
performance indicator, the S&P Composite 500 Stock Index, and an industry index, the S&P 500 Information Technology Index, for
the period from December 31, 2008, to December 31, 2013. The graph assumes that the value of the investment in the Class A
Common Stock and each index were $100 at December 31, 2008, and that all dividends were reinvested.
12/31/08 12/31/09 12/31/10 12/30/11 12/31/12 12/31/13
Lexmark International, Inc. $ 100 $ 97 $ 129 $ 124 $ 91 $ 145
S&P 500 Index 100 126 146 149 172 228
S&P 500 Technology Index 100 162 178 182 210 269
Source: Standard & Poor's Capital IQ
$0
$50
$100
$150
$200
$250
$300
12/31/08 12/31/09 12/31/10 12/30/11 12/31/12 12/31/13
Value in US Dollars
COMPARISON OF CUMULATIVE TOTAL RETURNS
Lexmark S&P 500 Index S&P Information Technology Index
23