Lexmark 2013 Annual Report Download - page 48
Download and view the complete annual report
Please find page 48 of the 2013 Lexmark annual report below. You can navigate through the pages in the report by either clicking on the pages listed below, or by using the keyword search tool below to find specific information within the annual report.-
 1
1 -
2
-
3
-
4
-
5
-
6
-
7
-
8
-
9
-
10
-
11
-
12
-
13
-
14
-
15
-
16
-
17
-
18
-
19
-
20
-
21
-
22
-
23
-
24
-
25
-
26
-
27
-
28
-
29
-
30
-
31
-
32
-
33
-
34
-
35
-
36
-
37
-
 38
38 -
 39
39 -
 40
40 -
 41
41 -
 42
42 -
 43
43 -
 44
44 -
 45
45 -
 46
46 -
 47
47 -
 48
48 -
 49
49 -
 50
50 -
 51
51 -
 52
52 -
 53
53 -
 54
54 -
 55
55 -
 56
56 -
 57
57 -
 58
58 -
59
-
60
-
61
-
62
-
63
-
64
-
65
-
66
-
67
-
68
-
69
-
70
-
71
-
72
-
73
-
74
-
75
-
76
-
77
-
78
-
79
-
80
-
81
-
82
-
83
-
84
-
85
-
86
-
87
-
88
-
89
-
90
-
91
-
92
-
93
-
94
-
95
-
96
-
97
-
98
-
99
-
100
-
101
-
102
-
103
-
104
-
105
-
106
-
107
-
108
-
109
-
110
-
111
-
112
-
113
-
114
-
115
-
116
-
117
-
118
-
119
-
120
-
121
-
122
-
123
-
124
-
125
-
126
-
127
-
128
-
129
-
130
-
131
-
132
-
133
-
134
-
135
-
136
-
137
-
138
-
139
-
140
-
141
-
142
-
143
-
144
-
145
-
146
-
147
-
148
-
149
-
150
-
151
-
152
 |
 |

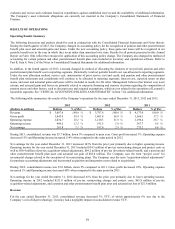
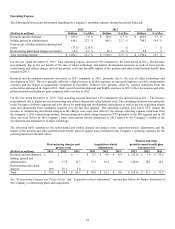
During 2013, total interest and other (income) expense, net, was an expense of $40.8 million, a 40% increase compared to the same
period in 2012. The loss of $3.3 million on extinguishment of debt is comprised of $3.2 million of premium paid upon repayment of
the Company’s 2013 senior notes and $0.1 million related to the write-off of related debt issuance costs.
During 2012, total interest and other (income) expense, net, was an expense of $29.1 million, a 1% decrease compared to the same
period in 2011.
Provision for Income Taxes and Related Matters
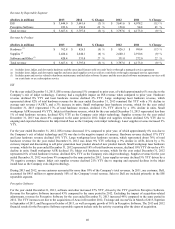
The Company’s effective income tax rate was approximately 28.9%, 33.8% and 18.7% in 2013, 2012 and 2011, respectively. Refer to
Part II, Item 8, Note 14 of the Notes to Consolidated Financial Statements for a reconciliation of the Company’s effective tax rate to
the U.S. statutory rate.
The 4.9 percentage point decrease of the effective tax rate from 2012 to 2013 was due primarily to a geographic shift in earnings
toward lower tax jurisdictions in 2013 compared to 2012, and to the reenactment of the U.S. research and experimentation tax credit
for the tax year 2012, which was recorded in 2013, the year of the enactment.
The 15.1 percentage point increase of the effective tax rate from 2011 to 2012 was due primarily to a geographic shift in earnings
toward higher tax jurisdictions in 2012 compared to 2011, and to the lack of the U.S. research and experimentation tax credit in 2012.
In January of 2013, the President signed into law The American Taxpayer Relief Act of 2012, which contained provisions that
retroactively extended the U.S. research and experimentation tax credit to 2012 and 2013. Because the extension did not happen by
December 31, 2012, the Company’s effective income tax rate for 2012 did not include the benefit of the credit for 2012. However,
because the credit was retroactively extended to include 2012, the Company recognized the full benefit of the 2012 credit in the first
quarter of 2013. The amount of the benefit was $6.0 million.
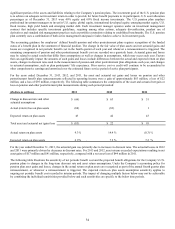
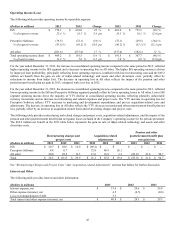
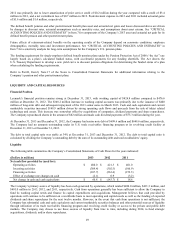
Net Earnings and Earnings per Share
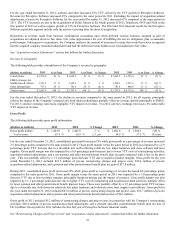
The following table summarizes net earnings and basic and diluted net earnings per share:
(Dollars in millions, except per share amounts) 2013 2012 2011
Net earnings $ 261.8 $ 107.6 $ 275.2
Basic earnings per share $ 4.16 $ 1.57 $ 3.57
Diluted earnings per share $ 4.08 $ 1.55 $ 3.53
Net earnings for the year ended December 31, 2013 increased 143% from the prior year primarily due to higher operating income and
a lower effective tax rate. For 2013, the YTY increase in basic and diluted earnings per share was primarily due to the increase in net
earnings and decrease in the average number of shares outstanding, due to the Company’s share repurchases.
Net earnings for the year ended December 31, 2012 decreased 61% from the prior year primarily due to lower operating income
combined with a higher effective tax rate when compared to the same period in 2011. For 2012, the YTY decrease in basic and diluted
earnings per share was primarily due to the decrease in net earnings partially offset by the decrease in the average number of shares
outstanding, due to the Company’s share repurchases.
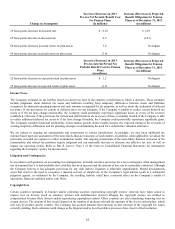
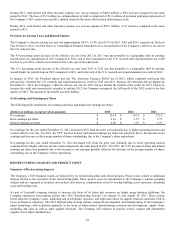
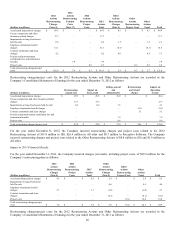
RESTRUCTURING CHARGES AND PROJECT COSTS
Summary of Restructuring Impacts
The Company’s 2013 financial results are impacted by its restructuring plans and related projects. Project costs consist of additional
charges related to the execution of the restructuring plans. These project costs are incremental to the Company’s normal operating
charges and are expensed as incurred, and include such items as compensation costs for overlap staffing, travel expenses, consulting
costs and training costs.
As part of Lexmark’s ongoing strategy to increase the focus of its talent and resources on higher usage business platforms, the
Company announced restructuring actions (the “2012 Restructuring Actions”) on January 31 and August 28, 2012. These actions
better align the Company’s sales, marketing and development resources, and align and reduce its support structure consistent with its
focus on business customers. The 2012 Restructuring Actions include exiting the development and manufacturing of the Company’s
inkjet technology, with reductions primarily in the areas of inkjet-related manufacturing, research and development, supply chain,
marketing and sales as well as other support functions. The Company will continue to provide service, support and aftermarket
supplies for its inkjet installed base.
44