Lexmark 2013 Annual Report Download - page 76
Download and view the complete annual report
Please find page 76 of the 2013 Lexmark annual report below. You can navigate through the pages in the report by either clicking on the pages listed below, or by using the keyword search tool below to find specific information within the annual report.-
 1
1 -
2
-
3
-
4
-
5
-
6
-
7
-
8
-
9
-
10
-
11
-
12
-
13
-
14
-
15
-
16
-
17
-
18
-
19
-
20
-
21
-
22
-
23
-
24
-
25
-
26
-
27
-
28
-
29
-
30
-
31
-
32
-
33
-
34
-
35
-
36
-
37
-
38
-
39
-
40
-
41
-
42
-
43
-
44
-
45
-
46
-
47
-
48
-
49
-
50
-
51
-
52
-
53
-
54
-
55
-
56
-
57
-
58
-
59
-
60
-
61
-
62
-
63
-
64
-
65
-
 66
66 -
 67
67 -
 68
68 -
 69
69 -
 70
70 -
 71
71 -
 72
72 -
 73
73 -
 74
74 -
 75
75 -
 76
76 -
 77
77 -
 78
78 -
 79
79 -
 80
80 -
 81
81 -
 82
82 -
 83
83 -
 84
84 -
 85
85 -
 86
86 -
87
-
88
-
89
-
90
-
91
-
92
-
93
-
94
-
95
-
96
-
97
-
98
-
99
-
100
-
101
-
102
-
103
-
104
-
105
-
106
-
107
-
108
-
109
-
110
-
111
-
112
-
113
-
114
-
115
-
116
-
117
-
118
-
119
-
120
-
121
-
122
-
123
-
124
-
125
-
126
-
127
-
128
-
129
-
130
-
131
-
132
-
133
-
134
-
135
-
136
-
137
-
138
-
139
-
140
-
141
-
142
-
143
-
144
-
145
-
146
-
147
-
148
-
149
-
150
-
151
-
152
 |
 |

72
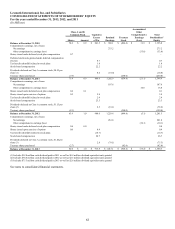
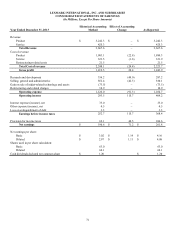
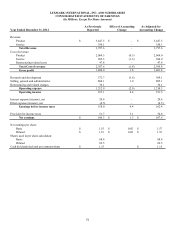
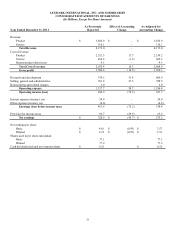
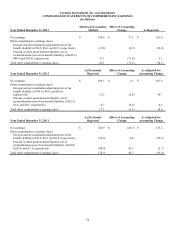
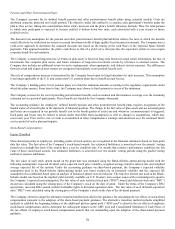
LEXMARK INTERNATIONAL, INC. AND SUBSIDIARIES
CONSOLIDATED STATEMENTS OF EARNINGS
(In Millions, Except Per Share Amounts)
Year Ended December 31, 2012
As Previously
Reported
Effect of Accounting
Change
As Adjusted for
Accounting Change
Revenue:
Product $ 3,447.5 $ – $ 3,447.5
Service 350.1 – 350.1
Total Revenue 3,797.6 – 3,797.6
Cost of revenue:
Product 2,064.5 (0.5) 2,064.0
Service 285.3 (1.3) 284.0
Restructuring-related costs 47.8 – 47.8
Total Cost of revenue 2,397.6 (1.8) 2,395.8
Gross profit 1,400.0 1.8 1,401.8
Research and development 372.7 (3.6) 369.1
Selling, general and administrative 804.1 1.0 805.1
Restructuring and related charges 36.1 – 36.1
Operating expense 1,212.9 (2.6) 1,210.3
Operating income 187.1 4.4 191.5
Interest expense (income), net 29.6 – 29.6
Other expense (income), net (0.5) – (0.5)
Earnings before income taxes 158.0 4.4 162.4
Provision for income taxes 51.7 3.1 54.8
Net earnings $ 106.3 $ 1.3 $ 107.6
Net earnings per share:
Basic $ 1.55 $ 0.02 $ 1.57
Diluted $ 1.53 $ 0.02 $ 1.55
Shares used in per share calculation:
Basic 68.6 68.6
Diluted 69.5 69.5
Cash dividends declared per common share $ 1.15 $ 1.15
72