Lexmark 2013 Annual Report Download - page 47
Download and view the complete annual report
Please find page 47 of the 2013 Lexmark annual report below. You can navigate through the pages in the report by either clicking on the pages listed below, or by using the keyword search tool below to find specific information within the annual report.-
 1
1 -
2
-
3
-
4
-
5
-
6
-
7
-
8
-
9
-
10
-
11
-
12
-
13
-
14
-
15
-
16
-
17
-
18
-
19
-
20
-
21
-
22
-
23
-
24
-
25
-
26
-
27
-
28
-
29
-
30
-
31
-
32
-
33
-
34
-
35
-
36
-
 37
37 -
 38
38 -
 39
39 -
 40
40 -
 41
41 -
 42
42 -
 43
43 -
 44
44 -
 45
45 -
 46
46 -
 47
47 -
 48
48 -
 49
49 -
 50
50 -
 51
51 -
 52
52 -
 53
53 -
 54
54 -
 55
55 -
 56
56 -
 57
57 -
58
-
59
-
60
-
61
-
62
-
63
-
64
-
65
-
66
-
67
-
68
-
69
-
70
-
71
-
72
-
73
-
74
-
75
-
76
-
77
-
78
-
79
-
80
-
81
-
82
-
83
-
84
-
85
-
86
-
87
-
88
-
89
-
90
-
91
-
92
-
93
-
94
-
95
-
96
-
97
-
98
-
99
-
100
-
101
-
102
-
103
-
104
-
105
-
106
-
107
-
108
-
109
-
110
-
111
-
112
-
113
-
114
-
115
-
116
-
117
-
118
-
119
-
120
-
121
-
122
-
123
-
124
-
125
-
126
-
127
-
128
-
129
-
130
-
131
-
132
-
133
-
134
-
135
-
136
-
137
-
138
-
139
-
140
-
141
-
142
-
143
-
144
-
145
-
146
-
147
-
148
-
149
-
150
-
151
-
152
 |
 |

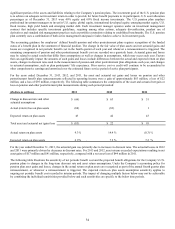
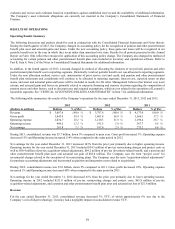
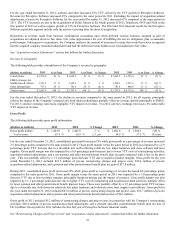
Operating Income (Loss)
The following table provides operating income by reportable segment:
(Dollars in millions) 2013 2012 Change 2012 2011 Change
ISS $ 770.3 $601.0 28 % $601.0 $ 779.3 (23) %
% of segment revenue 22.4 % 16.5 % 5.9 pts 16.5 % 19.1 % (2.6) pts
Perceptive Software (79.5) (72.1) (10) % (72.1) (29.5) (144) %
% of segment revenue (35.6) % (46.2) % 10.6 pts (46.2) % (31.1) % (15.1) pts
All other (281.6) (337.4) 17 % (337.4) (382.1) 12 %
Total operating income (loss) $ 409.2 $191.5 114 % $191.5 $ 367.7 (48) %
% of total revenue 11.2 % 5.0 % 6.2 pts 5.0 % 8.8 % (3.8) pts
For the year ended December 31, 2013, the increase in consolidated operating income compared to the same period in 2012, reflected
higher operating income in the ISS segment and a decrease in operating loss in All other. The higher ISS operating income is driven
by improved laser profitability, principally reflecting lower operating expenses, combined with lower restructuring costs and the $69.2
million net benefit from the gain on sale of inkjet-related technology and assets and other divestiture costs, partially offset by
reductions in income from Inkjet Exit. The decrease in operating loss in All other reflects the impact of the pension and other
postretirement benefit plan net gain in 2013, compared with a net loss in 2012.
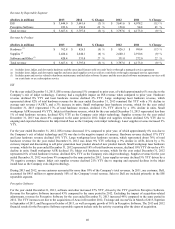
For the year ended December 31, 2012, the decrease in consolidated operating income compared to the same period in 2011, reflected
lower operating income in the ISS and Perceptive Software segments partially offset by lower operating losses in All other. Lower ISS
segment operating income drove the majority of YTY decline in consolidated operating income, reflecting primarily unfavorable
currency movements and an increase in restructuring and related expenses and project costs. The YTY increase in operating loss for
Perceptive Software reflects YTY increases in marketing and development expenditures and pre-tax acquisition-related costs and
adjustments. The decrease in operating loss in All other reflects the YTY decrease in pension and other postretirement benefit plan net
loss, partially offset by an increase in acquisition-related items and restructuring charges and project costs.
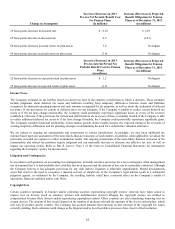
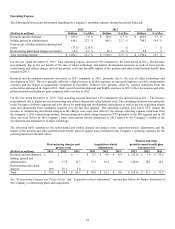
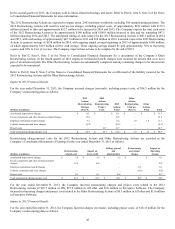
The following table provides restructuring and related charges and project costs, acquisition-related adjustments, and the impact of the
pension and other postretirement benefit plan net (gains) losses included in the Company’s operating income for the periods presented.
The $69.2 million net benefit in the 2013 table below represents the gain on sale of inkjet-related technology and assets and other
divestiture costs.
Pension and other
Restructuring charges and Acquisition-related postretirement benefit plan
project costs adjustments net (gain) loss
(Dollars in millions) 2013 2012 2011 2013 2012 2011 2013 2012 2011
ISS $ 29.7 $ 92.6 $ 16.6 $ (69.2) $ – $ $ – $ – $ –
Perceptive Software 4.8 0.7 – 72.8 46.9 26.1 – – –
All other 20.0 28.5 13.3 17.6 18.9 3.3 (83.0) 21.8 94.7
Total $ 54.5 $ 121.8 $ 29.9
$ 21.2 $ 65.8 $ 29.4 $ (83.0) $ 21.8 $ 94.7
See “Restructuring Charges and Project Costs” and “Acquisition-related Adjustments” sections that follow for further discussion.
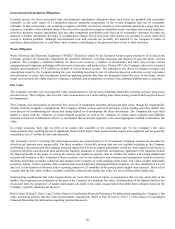
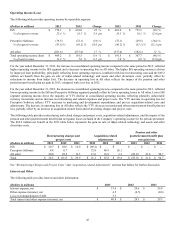
Interest and Other
The following table provides interest and other information:
(Dollars in millions) 2013 2012 2011
Interest expense, net $ 33.0 $ 29.6 $ 29.9
Other expense (income), net 4.5 (0.5) (0.6)
Loss on extinguishment of debt 3.3 – –
Total interest and other expense (income), net $ 40.8 $ 29.1 $ 29.3
43