Lexmark 2013 Annual Report Download - page 29
Download and view the complete annual report
Please find page 29 of the 2013 Lexmark annual report below. You can navigate through the pages in the report by either clicking on the pages listed below, or by using the keyword search tool below to find specific information within the annual report.-
 1
1 -
2
-
3
-
4
-
5
-
6
-
7
-
8
-
9
-
10
-
11
-
12
-
13
-
14
-
15
-
16
-
17
-
18
-
 19
19 -
 20
20 -
 21
21 -
 22
22 -
 23
23 -
 24
24 -
 25
25 -
 26
26 -
 27
27 -
 28
28 -
 29
29 -
 30
30 -
 31
31 -
 32
32 -
 33
33 -
 34
34 -
 35
35 -
 36
36 -
 37
37 -
 38
38 -
 39
39 -
40
-
41
-
42
-
43
-
44
-
45
-
46
-
47
-
48
-
49
-
50
-
51
-
52
-
53
-
54
-
55
-
56
-
57
-
58
-
59
-
60
-
61
-
62
-
63
-
64
-
65
-
66
-
67
-
68
-
69
-
70
-
71
-
72
-
73
-
74
-
75
-
76
-
77
-
78
-
79
-
80
-
81
-
82
-
83
-
84
-
85
-
86
-
87
-
88
-
89
-
90
-
91
-
92
-
93
-
94
-
95
-
96
-
97
-
98
-
99
-
100
-
101
-
102
-
103
-
104
-
105
-
106
-
107
-
108
-
109
-
110
-
111
-
112
-
113
-
114
-
115
-
116
-
117
-
118
-
119
-
120
-
121
-
122
-
123
-
124
-
125
-
126
-
127
-
128
-
129
-
130
-
131
-
132
-
133
-
134
-
135
-
136
-
137
-
138
-
139
-
140
-
141
-
142
-
143
-
144
-
145
-
146
-
147
-
148
-
149
-
150
-
151
-
152
 |
 |

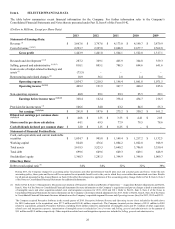
Item 6. SELECTED FINANCIAL DATA
The table below summarizes recent financial information for the Company. For further information refer to the Company’s
Consolidated Financial Statements and Notes thereto presented under Part II, Item 8 of this Form 10-K.
(Dollars in Millions, Except per Share Data)
2013 2012 2011 2010 2009
Statement of Earnings Data:
Revenue (1) $ 3,667.6 $ 3,797.6 $ 4,173.0 $ 4,199.7 $ 3,879.9
Cost of revenue (1)(2)(3) 2,223.7 2,395.8 2,608.9 2,677.7 2,562.8
Gross profit 1,443.9 1,401.8 1,564.1 1,522.0 1,317.1
Research and development (1)(3) 287.2 369.1 405.9 364.8 359.3
Selling, general and administrative (1)(2)(3) 810.1 805.1 788.5 694.6 641.6
Gain on sale of inkjet-related technology and
assets (1) (73.5) – – – –
Restructuring and related charges (2) 10.9 36.1 2.0 2.4 70.6
Operating expense 1,034.7 1,210.3 1,196.4 1,061.8 1,071.5
Operating income (1)(2)(3)
409.2 191.5 367.7 460.2 245.6
Non-operating expenses 40.8 29.1 29.3 25.5 29.1
Earnings before income taxes (1)(2)(3) 368.4 162.4 338.4 434.7 216.5
Provision for income taxes (4) 106.6 54.8 63.2 84.5 55.3
Net earnings (1)(2)(3)(4) $ 261.8 $ 107.6 $ 275.2 $ 350.2 $ 161.2
Diluted net earnings per common share
(1)(2)(3)(4) $ 4.08 $ 1.55 $ 3.53 $ 4.41 $ 2.05
Shares used in per share calculation 64.1 69.5 77.9 79.5 78.6
Cash dividends declared per common share $ 1.20 $ 1.15 $ 0.25 $ – $ –
Statement of Financial Position Data:
Cash, cash equivalents and current marketable
securities $ 1,054.7 $ 905.8 $ 1,149.4 $ 1,217.2 $ 1,132.5
Working capital 824.8 476.6 1,084.2 1,022.0 948.9
Total assets 3,619.5 3,525.3 3,640.2 3,706.8 3,350.4
Total debt 699.6 649.6 649.3 649.1 648.9
Stockholders' equity 1,368.3 1,281.5 1,394.9 1,396.0 1,009.7
Other Key Data:
Debt to total capital ratio (5) 34% 34% 32% 32% 39%
During 2013, the Company changed its accounting policy for pension and other postretirement benefit plan asset and actuarial gains and losses. Under the new
accounting policy, these gains and losses will be recognized in net periodic benefit cost in the year in which they occur rather than amortized over time. Results
for all periods presented in this Annual Report on Form 10-K reflect the retrospective application of this accounting policy change. Refer to Part II, Item 8, Note 2
of the Notes to Consolidated Financial Statements for additional information.
(1) Refer to Part II, Item 7, Management’s Discussion and Analysis of Financial Condition and Results of Operations — Acquisition-Related Adjustments and Part II,
Item 8, Note 4 of the Notes to Consolidated Financial Statements for more information on the Company’s acquisitions and pre-tax charges related to amortization
of intangible assets and other acquisition-related costs and integration expenses for 2013, 2012 and 2011. Refer to Part II, Item 8, Note 4 of the Notes to
Consolidated Financial Statements for more information on the Company’s divestiture-related adjustments for 2013. Refer to Part II, Item 8, Note 20 of the Notes
to Consolidated Financial Statements for more information on the Company’s reportable segment Revenue and Operating income (loss) for 2013, 2012 and 2011.
The Company acquired Perceptive Software in the second quarter of 2010. Perceptive Software Revenue and Operating income (loss) included in the table above
for 2010 (subsequent to the acquisition) were $37.3 million and $(16.0) million, respectively. The Company incurred pre-tax charges of $19.1 million in 2010
related to acquisitions, primarily Perceptive Software, including $12.0 million related to amortization of intangible assets and $7.1 million of other acquisition-
related costs and integration expenses. Amortization of intangible assets is included in Cost of revenue and Selling, general and administrative in the amount of
$9.1 million and $2.9 million, respectively. Other acquisition-related costs and integration expenses are included in Selling, general and administrative.
25