Lexmark 2013 Annual Report Download - page 108
Download and view the complete annual report
Please find page 108 of the 2013 Lexmark annual report below. You can navigate through the pages in the report by either clicking on the pages listed below, or by using the keyword search tool below to find specific information within the annual report.-
 1
1 -
2
-
3
-
4
-
5
-
6
-
7
-
8
-
9
-
10
-
11
-
12
-
13
-
14
-
15
-
16
-
17
-
18
-
19
-
20
-
21
-
22
-
23
-
24
-
25
-
26
-
27
-
28
-
29
-
30
-
31
-
32
-
33
-
34
-
35
-
36
-
37
-
38
-
39
-
40
-
41
-
42
-
43
-
44
-
45
-
46
-
47
-
48
-
49
-
50
-
51
-
52
-
53
-
54
-
55
-
56
-
57
-
58
-
59
-
60
-
61
-
62
-
63
-
64
-
65
-
66
-
67
-
68
-
69
-
70
-
71
-
72
-
73
-
74
-
75
-
76
-
77
-
78
-
79
-
80
-
81
-
82
-
83
-
84
-
85
-
86
-
87
-
88
-
89
-
90
-
91
-
92
-
93
-
94
-
95
-
96
-
97
-
 98
98 -
 99
99 -
 100
100 -
 101
101 -
 102
102 -
 103
103 -
 104
104 -
 105
105 -
 106
106 -
 107
107 -
 108
108 -
 109
109 -
 110
110 -
 111
111 -
 112
112 -
 113
113 -
 114
114 -
 115
115 -
 116
116 -
 117
117 -
 118
118 -
119
-
120
-
121
-
122
-
123
-
124
-
125
-
126
-
127
-
128
-
129
-
130
-
131
-
132
-
133
-
134
-
135
-
136
-
137
-
138
-
139
-
140
-
141
-
142
-
143
-
144
-
145
-
146
-
147
-
148
-
149
-
150
-
151
-
152
 |
 |
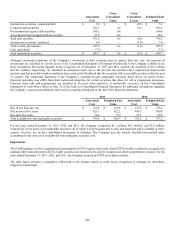
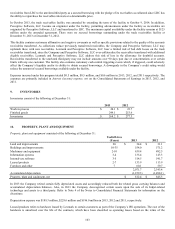
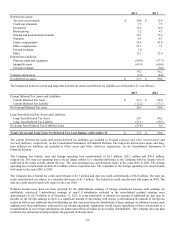
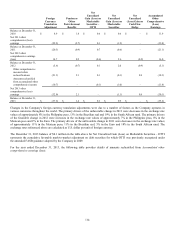
arrangements. The accumulated depreciation related to the Company’s leased products was $89.7 million and $76.5 million at year-
end 2013 and 2012, respectively.
The Company accounts for its internal-use software, an intangible asset by nature, in Property, plant and equipment, net on the
Consolidated Statements of Financial Position. Amortization expense related to internal-use software is included in the depreciation
expense values shown above and was $80.8 million, $69.3 million and $60.8 million in 2013, 2012 and 2011, respectively. The net
carrying amounts of internal-use software at December 31, 2013 and 2012 were $209.7 million and $230.0 million, respectively. The
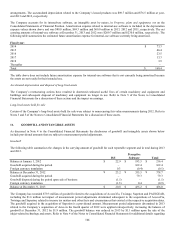
following table summarizes the estimated future amortization expense for internal-use software currently being amortized.
Fiscal year:
2014 $ 73.3
2015 46.4
2016 23.5
2017 13.3
2018 3.9
Thereafter –
Total $160.4
The table above does not include future amortization expense for internal-use software that is not currently being amortized because
the assets are not ready for their intended use.
Accelerated depreciation and disposal of long-lived assets
The Company’s restructuring actions have resulted in shortened estimated useful lives of certain machinery and equipment and
buildings and subsequent disposal of machinery and equipment no longer in use. Refer to Note 5 of the Notes to Consolidated
Financial Statements for a discussion of these actions and the impact on earnings.
Long-lived assets held for sale
Certain of the Company’s long-lived assets held for sale were subject to nonrecurring fair value measurements during 2012. Refer to
Notes 3 and 5 of the Notes to Consolidated Financial Statements for a discussion of these assets.
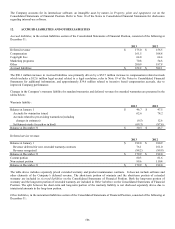
11. GOODWILL AND INTANGIBLE ASSETS
As discussed in Note 4 to the Consolidated Financial Statements the disclosures of goodwill and intangible assets shown below
include provisional amounts that are subject to measurement period adjustments.
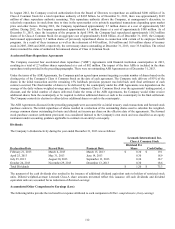
Goodwill
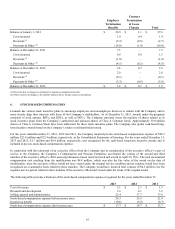
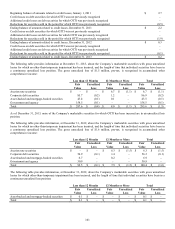
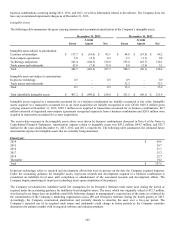
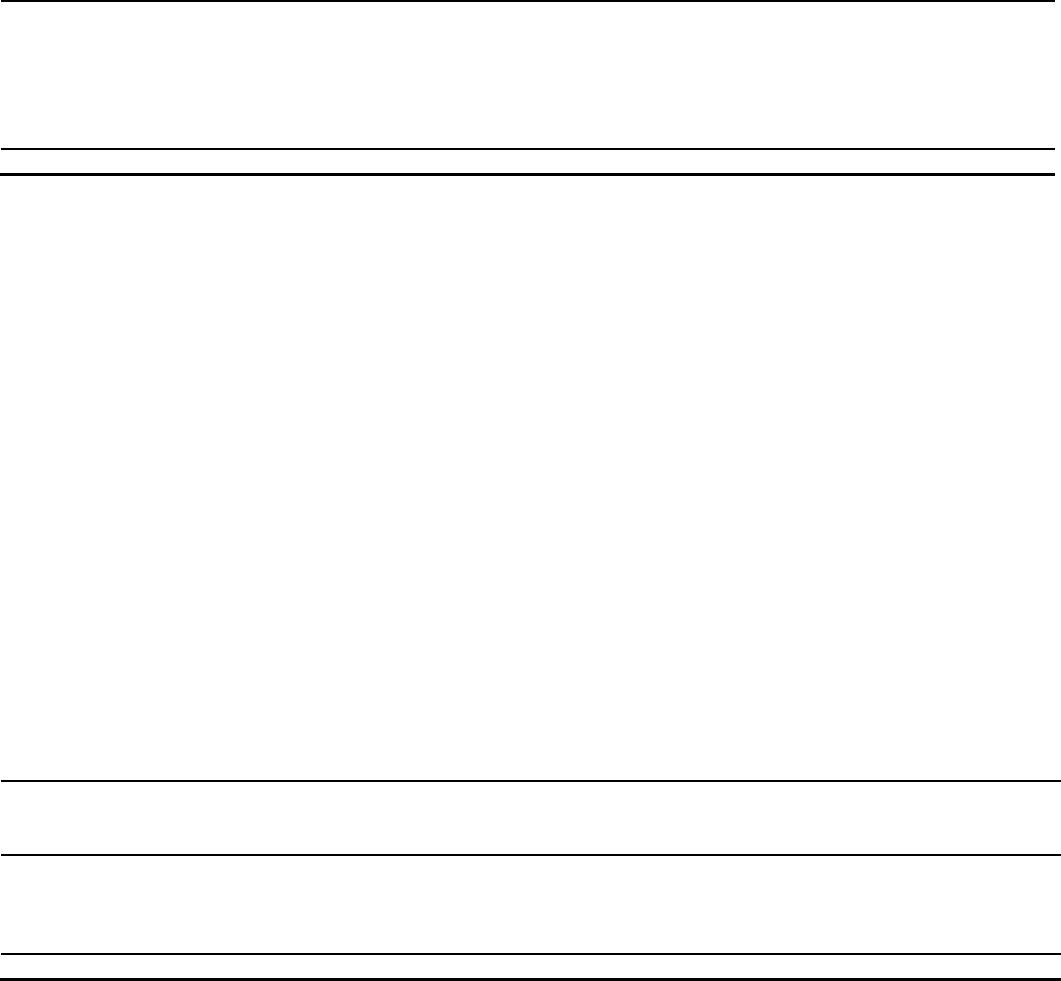
The following table summarizes the changes in the carrying amount of goodwill for each reportable segment and in total during 2013
and 2012.
ISS
Perceptive
Software Total
Balance at January 1, 2012 $ 22.9 $ 193.5 $ 216.4
Goodwill acquired during the period – 162.4 162.4
Foreign currency translation 0.3 (0.4) (0.1)
Balance at December 31, 2012 $23.2 $ 355.5 $378.7
Goodwill acquired during the period – 79.3 79.3
Goodwill disposed during the period upon sale of business (1.1) – (1.1)
Foreign currency translation (1.3) 0.4 (0.9)
Balance at December 31, 2013 $20.8 $ 435.2 $456.0
The Company has recorded $79.3 million of goodwill related to the acquisitions of AccessVia, Twistage, Saperion and PACSGEAR,
including the $1.6 million net impact of measurement period adjustments determined subsequent to the acquisitions of AccessVia,
Twistage and Saperion, related to income tax matters and other facts and circumstances that existed at the respective acquisition dates.
The goodwill acquired in the acquisition of Saperion is a provisional amount. Measurement period adjustments determined in 2013
related to the Company’s acquisition of Acuo in the fourth quarter of 2012 were applied retrospectively, increasing the balance of
goodwill at December 31, 2012 by $1.9 million. The goodwill balance was reduced in 2013 by $1.1 million upon the sale of the
inkjet-related technology and assets. Refer to Note 4 of the Notes to Consolidated Financial Statements for additional details regarding
104