Lexmark 2013 Annual Report Download - page 124
Download and view the complete annual report
Please find page 124 of the 2013 Lexmark annual report below. You can navigate through the pages in the report by either clicking on the pages listed below, or by using the keyword search tool below to find specific information within the annual report.-
 1
1 -
2
-
3
-
4
-
5
-
6
-
7
-
8
-
9
-
10
-
11
-
12
-
13
-
14
-
15
-
16
-
17
-
18
-
19
-
20
-
21
-
22
-
23
-
24
-
25
-
26
-
27
-
28
-
29
-
30
-
31
-
32
-
33
-
34
-
35
-
36
-
37
-
38
-
39
-
40
-
41
-
42
-
43
-
44
-
45
-
46
-
47
-
48
-
49
-
50
-
51
-
52
-
53
-
54
-
55
-
56
-
57
-
58
-
59
-
60
-
61
-
62
-
63
-
64
-
65
-
66
-
67
-
68
-
69
-
70
-
71
-
72
-
73
-
74
-
75
-
76
-
77
-
78
-
79
-
80
-
81
-
82
-
83
-
84
-
85
-
86
-
87
-
88
-
89
-
90
-
91
-
92
-
93
-
94
-
95
-
96
-
97
-
98
-
99
-
100
-
101
-
102
-
103
-
104
-
105
-
106
-
107
-
108
-
109
-
110
-
111
-
112
-
113
-
 114
114 -
 115
115 -
 116
116 -
 117
117 -
 118
118 -
 119
119 -
 120
120 -
 121
121 -
 122
122 -
 123
123 -
 124
124 -
 125
125 -
 126
126 -
 127
127 -
 128
128 -
 129
129 -
 130
130 -
 131
131 -
 132
132 -
 133
133 -
 134
134 -
135
-
136
-
137
-
138
-
139
-
140
-
141
-
142
-
143
-
144
-
145
-
146
-
147
-
148
-
149
-
150
-
151
-
152
 |
 |

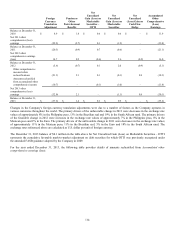
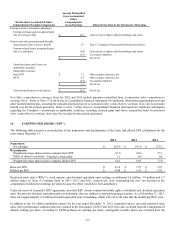
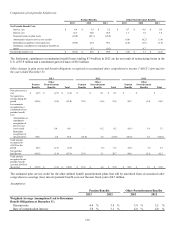
The following table sets forth by level, within the fair value hierarchy, plan assets measured at fair value on a recurring basis as of
December 31, 2013 and 2012:
December 31, 2013 December 31, 2012
Level 1 Level 2 Level 3 Total Level 1 Level 2 Level 3 Total
Commingled trust funds:
Fixed income $ – $ 210.1 $ – $ 210.1 $ – $ 245.4 $ – $ 245.4
International equity large-
ca
p
– 92.9 – 92.9 – 124.1 – 124.1
International equity
small-ca
p
– 20.8 – 20.8 – 30.5 – 30.5
Emerging market equity – 24.5 – 24.5 – 27.8 – 27.8
Emerging market debt – 26.6 – 26.6 – 27.5 – 27.5
Global equity – 39.2 – 39.2 – 46.7 – 46.7
U.S. equity – 89.8 – 89.8 – 96.8 – 96.8
Real estate – 4.8 – 4.8 – 3.6 – 3.6
Mutual and money market
funds:
Small mid-cap value – – – – 13.8 – – 13.8
Money market fund – – – – – 1.3 – 1.3
Fixed income:
Government and agency
debt securities – 33.0 – 33.0 – – – –
Corporate debt securities – 133.0 1.6 134.6 – 27.7 2.0 29.7
Asset-backed and
mortgage-backed
securities – 11.1 2.5 13.6 – – – –
U.S. equity securities:
Small mid-cap growth – – – – 13.2 – – 13.2
Cash equivalent – 2.3 – 2.3 – 0.2 – 0.2
Subtotal – 688.1 4.1 692.2 27.0 631.6 2.0 660.6
Cash – – – 2.2 – – – –
Employer and benefits
p
a
y
able – – – (2.3) – – – –
Total assets at fair value $ – $ 688.1 $ 4.1 $ 692.1 $ 27.0 $ 631.6 $ 2.0 $ 660.6
The following table sets forth a summary of changes in the fair value of level 3 assets at December 31:
2013 2012
Total
Fixed Income -
Corporate debt
securities
Fixed Income -
Asset-backed
securities
Fixed Income -
Corporate debt
securities
Fair value at beginning of year $ 2.0 $ 2.0 $ – $ 2.0
Actual return on plan assets - assets held at reporting date – – – –
Actual return on plan assets - assets sold during period (0.1) – (0.1) –
Purchases, sales and settlements, net 2.6 – 2.6 0.1
Transfers in/(transfers out), net (0.4) (0.4) – (0.1)
Fair value at end of year $ 4.1 $ 1.6 $ 2.5 $ 2.0
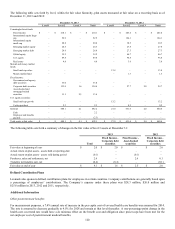
Defined Contribution Plans
Lexmark also sponsors defined contribution plans for employees in certain countries. Company contributions are generally based upon
a percentage of employees’ contributions. The Company’s expense under these plans was $28.3 million, $26.0 million and
$25.6 million in 2013, 2012 and 2011, respectively.
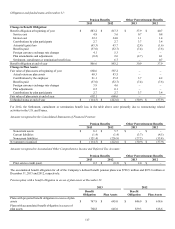
Additional Information
Other postretirement benefits:
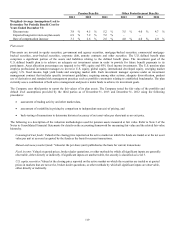
For measurement purposes, a 7.4% annual rate of increase in the per capita cost of covered health care benefits was assumed for 2014.
The rate is assumed to decrease gradually to 4.5% for 2028 and remain at that level thereafter. A one-percentage-point change in the
health care cost trend rate would have a de minimus effect on the benefit cost and obligation since preset caps have been met for the
net employer cost of postretirement medical benefits.
120