Lexmark 2013 Annual Report Download - page 53
Download and view the complete annual report
Please find page 53 of the 2013 Lexmark annual report below. You can navigate through the pages in the report by either clicking on the pages listed below, or by using the keyword search tool below to find specific information within the annual report.-
 1
1 -
2
-
3
-
4
-
5
-
6
-
7
-
8
-
9
-
10
-
11
-
12
-
13
-
14
-
15
-
16
-
17
-
18
-
19
-
20
-
21
-
22
-
23
-
24
-
25
-
26
-
27
-
28
-
29
-
30
-
31
-
32
-
33
-
34
-
35
-
36
-
37
-
38
-
39
-
40
-
41
-
42
-
 43
43 -
 44
44 -
 45
45 -
 46
46 -
 47
47 -
 48
48 -
 49
49 -
 50
50 -
 51
51 -
 52
52 -
 53
53 -
 54
54 -
 55
55 -
 56
56 -
 57
57 -
 58
58 -
 59
59 -
 60
60 -
 61
61 -
 62
62 -
 63
63 -
64
-
65
-
66
-
67
-
68
-
69
-
70
-
71
-
72
-
73
-
74
-
75
-
76
-
77
-
78
-
79
-
80
-
81
-
82
-
83
-
84
-
85
-
86
-
87
-
88
-
89
-
90
-
91
-
92
-
93
-
94
-
95
-
96
-
97
-
98
-
99
-
100
-
101
-
102
-
103
-
104
-
105
-
106
-
107
-
108
-
109
-
110
-
111
-
112
-
113
-
114
-
115
-
116
-
117
-
118
-
119
-
120
-
121
-
122
-
123
-
124
-
125
-
126
-
127
-
128
-
129
-
130
-
131
-
132
-
133
-
134
-
135
-
136
-
137
-
138
-
139
-
140
-
141
-
142
-
143
-
144
-
145
-
146
-
147
-
148
-
149
-
150
-
151
-
152
 |
 |

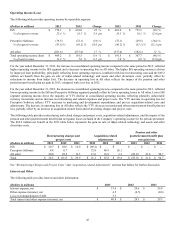
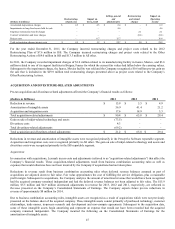
2012 was primarily due to lower amortization of prior service credit of $0.2 million during the year compared with a credit of $3.4
million in 2011, and a net curtailment loss of $0.7 million in 2012. Postretirement expense in 2012 and 2011 included actuarial gains
of $1.6 million and $1.4 million, respectively.
The defined benefit pension and other postretirement benefit plan asset and actuarial net gains and losses discussed above are driven
by changes in discount rates, actuarial assumptions such as mortality rates, and assumptions about asset returns. See “CRITICAL
ACCOUNTING POLICIES AND ESTIMATES” in Item 7 for components of the Company’s 2013 asset and actuarial net gain for its
defined benefit pension and other postretirement plans.
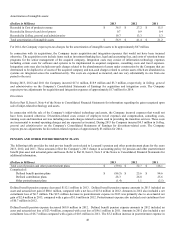
Future effects of retirement-related benefits on the operating results of the Company depend on economic conditions, employee
demographics, mortality rates and investment performance. See “CRITICAL ACCOUNTING POLICIES AND ESTIMATES” in
Item 7 for a sensitivity analysis for long-term assumptions for the Company’s U.S. pension plans.
The funding requirement for single-employer defined benefit pension plans under the Pension Protection Act of 2006 (“the Act”) are
largely based on a plan’s calculated funded status, with accelerated payments for any funding shortfalls. The Act directs the
U.S. Treasury Department to develop a new yield curve to discount pension obligations for determining the funded status of a plan
when calculating the funding requirements.
Refer to Part II, Item 8, Note 17 of the Notes to Consolidated Financial Statements for additional information relating to the
Company’s pension and other postretirement plans.
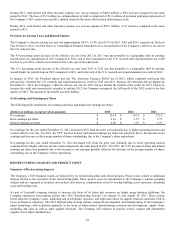
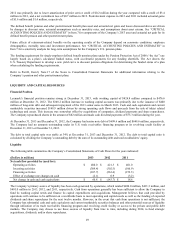
LIQUIDITY AND CAPITAL RESOURCES
Financial Position
Lexmark’s financial position remains strong at December 31, 2013, with working capital of $824.8 million compared to $476.6
million at December 31, 2012. The $348.2 million increase in working capital accounts was primarily due to the issuance of $400
million of long-term debt and subsequent repayment of the 2013 senior notes in March 2013. Cash and cash equivalents and current
marketable securities increased $148.9 million driven by strong operating cash flows and proceeds from the sale of inkjet related
technology and assets. This increase was somewhat offset by acquisitions of companies, dividend payments and share repurchases.
The Company repurchased shares in the amount of $82 million and made cash dividend payments of $75.3 million during the year.
At December 31, 2013 and December 31, 2012, the Company had senior note debt of $699.6 million and $649.6 million, respectively.
The Company had no amounts outstanding under its U.S. trade receivables financing program or its revolving credit facility at
December 31, 2013 or December 31, 2012.
The debt to total capital ratio was stable at 34% at December 31, 2013 and December 31, 2012. The debt to total capital ratio is
calculated by dividing the Company’s outstanding debt by the sum of its outstanding debt and total stockholders’ equity.
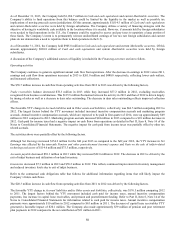
Liquidity
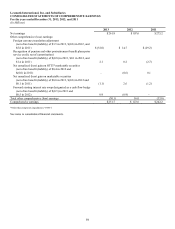
The following table summarizes the Company’s Consolidated Statements of Cash Flows for the years indicated:
(Dollars in millions) 2013 2012 2011
Net cash flow provided by (used for):
Operating activities $ 480.0 $ 421.3 $ 401.0
Investing activities (309.4) (302.5) (106.9)
Financing activities (107.7) (263.4) (272.3)
Effect of exchange rate changes on cash (2.1) 0.9 (3.2)
Net change in cash and cash equivalents $ 60.8 $ (143.7) $ 18.6
The Company’s primary source of liquidity has been cash generated by operations, which totaled $480.0 million, $421.3 million, and
$401.0 million in 2013, 2012, and 2011, respectively. Cash from operations generally has been sufficient to allow the Company to
fund its working capital needs and finance its capital expenditures and acquisitions. Management believes that cash provided by
operations will continue to be sufficient on a worldwide basis to meet operating and capital needs as well as the funding of expected
dividends and share repurchases for the next twelve months. However, in the event that cash from operations is not sufficient, the
Company has substantial cash and cash equivalents and current marketable securities balances and other potential sources of liquidity
through utilization of its trade receivables financing program and revolving credit facility or access to the private and public debt
markets. The Company may choose to use these sources of liquidity from time to time, including during 2014, to fund strategic
acquisitions, dividends, and/or share repurchases.
49