Lexmark 2013 Annual Report Download - page 77
Download and view the complete annual report
Please find page 77 of the 2013 Lexmark annual report below. You can navigate through the pages in the report by either clicking on the pages listed below, or by using the keyword search tool below to find specific information within the annual report.-
 1
1 -
 2
2 -
 3
3 -
 4
4 -
 5
5 -
 6
6 -
 7
7 -
 8
8 -
 9
9 -
 10
10 -
 11
11 -
 12
12 -
 13
13 -
 14
14 -
 15
15 -
 16
16 -
 17
17 -
 18
18 -
 19
19 -
 20
20 -
 21
21 -
 22
22 -
 23
23 -
 24
24 -
 25
25 -
 26
26 -
 27
27 -
 28
28 -
 29
29 -
 30
30 -
 31
31 -
 32
32 -
 33
33 -
 34
34 -
 35
35 -
 36
36 -
 37
37 -
 38
38 -
 39
39 -
 40
40 -
 41
41 -
 42
42 -
 43
43 -
 44
44 -
 45
45 -
 46
46 -
 47
47 -
 48
48 -
 49
49 -
 50
50 -
 51
51 -
 52
52 -
 53
53 -
 54
54 -
 55
55 -
 56
56 -
 57
57 -
 58
58 -
 59
59 -
 60
60 -
 61
61 -
 62
62 -
 63
63 -
 64
64 -
 65
65 -
 66
66 -
 67
67 -
 68
68 -
 69
69 -
 70
70 -
 71
71 -
 72
72 -
 73
73 -
 74
74 -
 75
75 -
 76
76 -
 77
77 -
 78
78 -
 79
79 -
 80
80 -
 81
81 -
 82
82 -
 83
83 -
 84
84 -
 85
85 -
 86
86 -
 87
87 -
 88
88 -
 89
89 -
 90
90 -
 91
91 -
 92
92 -
 93
93 -
 94
94 -
 95
95 -
 96
96 -
 97
97 -
 98
98 -
 99
99 -
 100
100 -
 101
101 -
 102
102 -
 103
103 -
 104
104 -
 105
105 -
 106
106 -
 107
107 -
 108
108 -
 109
109 -
 110
110 -
 111
111 -
 112
112 -
 113
113 -
 114
114 -
 115
115 -
 116
116 -
 117
117 -
 118
118 -
 119
119 -
 120
120 -
 121
121 -
 122
122 -
 123
123 -
 124
124 -
 125
125 -
 126
126 -
 127
127 -
 128
128 -
 129
129 -
 130
130 -
 131
131 -
 132
132 -
 133
133 -
 134
134 -
 135
135 -
 136
136 -
 137
137 -
 138
138 -
 139
139 -
 140
140 -
 141
141 -
 142
142 -
 143
143 -
 144
144 -
 145
145 -
 146
146 -
 147
147 -
 148
148 -
 149
149 -
 150
150 -
 151
151 -
 152
152
 |
 |

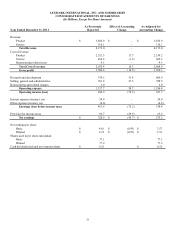
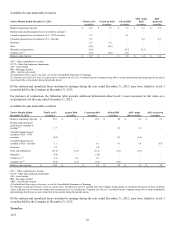
LEXMARK INTERNATIONAL, INC. AND SUBSIDIARIES
CONSOLIDATED STATEMENTS OF EARNINGS
(In Millions, Except Per Share Amounts)
Year Ended December 31, 2011
As Previously
Reported
Effect of Accounting
Change
As Adjusted for
Accounting Change
Revenue:
Product $ 3,856.9 $ – $ 3,856.9
Service 316.1 – 316.1
Total Revenue 4,173.0 – 4,173.0
Cost of revenue:
Product 2,321.5 17.7 2,339.2
Service 266.4 (1.2) 265.2
Restructuring-related costs 4.5 – 4.5
Total Cost of revenue 2,592.4 16.5 2,608.9
Gross profit 1,580.6 (16.5) 1,564.1
Research and development 374.5 31.4 405.9
Selling, general and administrative 761.2 27.3 788.5
Restructuring and related charges 2.0 – 2.0
Operating expense 1,137.7 58.7 1,196.4
Operating income (loss) 442.9 (75.2) 367.7
Interest expense (income), net 29.9 – 29.9
Other expense (income), net (0.6) – (0.6)
Earnings (loss) before income taxes 413.6 (75.2) 338.4
Provision for income taxes 92.7 (29.5) 63.2
Net earnings $ 320.9 $ (45.7) $ 275.2
Net earnings per share:
Basic $ 4.16 $ (0.59) $ 3.57
Diluted $ 4.12 $ (0.59) $ 3.53
Shares used in per share calculation:
Basic 77.1 77.1
Diluted 77.9 77.9
Cash dividends declared per common share $ 0.25 $ 0.25
73
