Lexmark 2013 Annual Report Download - page 52
Download and view the complete annual report
Please find page 52 of the 2013 Lexmark annual report below. You can navigate through the pages in the report by either clicking on the pages listed below, or by using the keyword search tool below to find specific information within the annual report.-
 1
1 -
2
-
3
-
4
-
5
-
6
-
7
-
8
-
9
-
10
-
11
-
12
-
13
-
14
-
15
-
16
-
17
-
18
-
19
-
20
-
21
-
22
-
23
-
24
-
25
-
26
-
27
-
28
-
29
-
30
-
31
-
32
-
33
-
34
-
35
-
36
-
37
-
38
-
39
-
40
-
41
-
 42
42 -
 43
43 -
 44
44 -
 45
45 -
 46
46 -
 47
47 -
 48
48 -
 49
49 -
 50
50 -
 51
51 -
 52
52 -
 53
53 -
 54
54 -
 55
55 -
 56
56 -
 57
57 -
 58
58 -
 59
59 -
 60
60 -
 61
61 -
 62
62 -
63
-
64
-
65
-
66
-
67
-
68
-
69
-
70
-
71
-
72
-
73
-
74
-
75
-
76
-
77
-
78
-
79
-
80
-
81
-
82
-
83
-
84
-
85
-
86
-
87
-
88
-
89
-
90
-
91
-
92
-
93
-
94
-
95
-
96
-
97
-
98
-
99
-
100
-
101
-
102
-
103
-
104
-
105
-
106
-
107
-
108
-
109
-
110
-
111
-
112
-
113
-
114
-
115
-
116
-
117
-
118
-
119
-
120
-
121
-
122
-
123
-
124
-
125
-
126
-
127
-
128
-
129
-
130
-
131
-
132
-
133
-
134
-
135
-
136
-
137
-
138
-
139
-
140
-
141
-
142
-
143
-
144
-
145
-
146
-
147
-
148
-
149
-
150
-
151
-
152
 |
 |

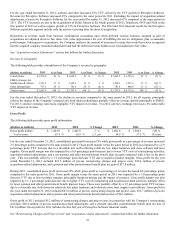
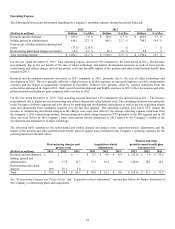
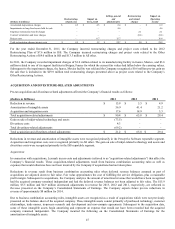
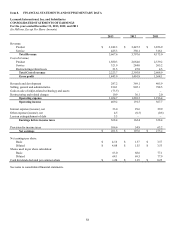
Amortization of intangible assets:
(Dollars in Millions) 2013 2012 2011
Recorded in Cost of product revenue $ 36.5 $ 27.2 $ 15.5
Recorded in Research and development 0.7 0.9 0.4
Recorded in Selling, general and administrative 19.7 13.3 5.3
Total amortization of intangible assets $ 56.9 $ 41.4 $ 21.2
For 2014, the Company expects pre-tax charges for the amortization of intangible assets to be approximately $67 million.
In connection with its acquisitions, the Company incurs acquisition and integration expenses that would not have been incurred
otherwise. The acquisition costs include items such as investment banking fees, legal and accounting fees, and costs of retention bonus
programs for the senior management of the acquired company. Integration costs may consist of information technology expenses
including certain costs for software and systems to be implemented in acquired companies, consulting costs and travel expenses.
Integration costs may also include non-cash charges related to the abandonment of assets under construction by the Company that are
determined to be duplicative of assets of the acquired company and non-cash charges related to certain assets which are abandoned as
systems are integrated across the combined entity. The costs are expensed as incurred, and can vary substantially in size from one
period to the next.
During 2013, 2012 and 2011 the Company incurred $17.6 million, $18.9 million and $3.3 million, respectively, in Selling, general
and administrative on the Company’s Consolidated Statements of Earnings for acquisition and integration costs. The Company
expects pre-tax adjustments for acquisition and integration expenses of approximately $17 million for 2014.
Divestiture
Refer to Part II, Item 8, Note 4 of the Notes to Consolidated Financial Statements for information regarding the gain recognized upon
sale of inkjet-related technology and assets.
In connection with the sale of the Company’s inkjet-related technology and assets, the Company incurred expenses that would not
have been incurred otherwise. Divestiture-related costs consist of employee travel expenses and compensation, consulting costs,
training costs and transition services including non-cash charges related to assets used in providing the transition services. These costs
are incremental to normal operating charges and are expensed as incurred. During 2013 the Company incurred $4.3 million in Selling,
general and administrative on the Company’s Consolidated Statements of Earnings for divestiture-related costs. The Company
expects pre-tax adjustments for divestiture-related expenses of approximately $3 million for 2014.
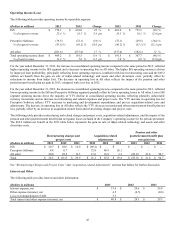
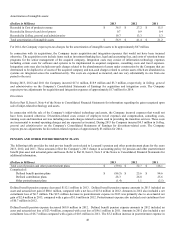
PENSION AND OTHER POSTRETIREMENT PLANS
The following table provides the total pre-tax benefit costs related to Lexmark’s pension and other postretirement plans for the years
2013, 2012, and 2011. These amounts reflect the Company’s 2013 change in accounting policy for pension and other postretirement
benefit plan asset and actuarial gains and losses. Refer to Part II, Item 8, Note 2 of the Notes to Consolidated Financial Statements for
additional information.
(Dollars in Millions) 2013 2012 2011
Total cost of pension and other postretirement plans $ (59.6) $ 52.7 $ 118.1
Comprised of:
Defined benefit pension plans $ (86.5) $ 25.6 $ 94.6
Defined contribution plans 28.3 26.0 25.6
Other postretirement plans (1.4) 1.1 (2.1)
Defined benefit pension expense decreased $112.1 million in 2013. Defined benefit pension expense amounts in 2013 included an
asset and actuarial net gain of $80.6 million, compared with a net loss of $23.4 million in 2012. Amounts in 2012 also included a net
curtailment loss of $6.7 million. The $2.5 million decrease in postretirement expense in 2013 was primarily due to an actuarial net
gain of $2.4 million in 2013, compared with a gain of $1.6 million in 2012. Postretirement expense also included a net curtailment loss
of $0.7 million in 2012.
Defined benefit pension expense decreased $69.0 million in 2012. Defined benefit pension expense amounts in 2012 included an
asset and actuarial net loss of $23.4 million, compared with a net loss of $96.1 million in 2011. Amounts in 2012 also included a net
curtailment loss of $6.7 million compared with a gain of $0.3 million in 2011. The $3.2 million increase in postretirement expense in
48