Lexmark 2013 Annual Report Download - page 105
Download and view the complete annual report
Please find page 105 of the 2013 Lexmark annual report below. You can navigate through the pages in the report by either clicking on the pages listed below, or by using the keyword search tool below to find specific information within the annual report.-
 1
1 -
2
-
3
-
4
-
5
-
6
-
7
-
8
-
9
-
10
-
11
-
12
-
13
-
14
-
15
-
16
-
17
-
18
-
19
-
20
-
21
-
22
-
23
-
24
-
25
-
26
-
27
-
28
-
29
-
30
-
31
-
32
-
33
-
34
-
35
-
36
-
37
-
38
-
39
-
40
-
41
-
42
-
43
-
44
-
45
-
46
-
47
-
48
-
49
-
50
-
51
-
52
-
53
-
54
-
55
-
56
-
57
-
58
-
59
-
60
-
61
-
62
-
63
-
64
-
65
-
66
-
67
-
68
-
69
-
70
-
71
-
72
-
73
-
74
-
75
-
76
-
77
-
78
-
79
-
80
-
81
-
82
-
83
-
84
-
85
-
86
-
87
-
88
-
89
-
90
-
91
-
92
-
93
-
94
-
 95
95 -
 96
96 -
 97
97 -
 98
98 -
 99
99 -
 100
100 -
 101
101 -
 102
102 -
 103
103 -
 104
104 -
 105
105 -
 106
106 -
 107
107 -
 108
108 -
 109
109 -
 110
110 -
 111
111 -
 112
112 -
 113
113 -
 114
114 -
 115
115 -
116
-
117
-
118
-
119
-
120
-
121
-
122
-
123
-
124
-
125
-
126
-
127
-
128
-
129
-
130
-
131
-
132
-
133
-
134
-
135
-
136
-
137
-
138
-
139
-
140
-
141
-
142
-
143
-
144
-
145
-
146
-
147
-
148
-
149
-
150
-
151
-
152
 |
 |

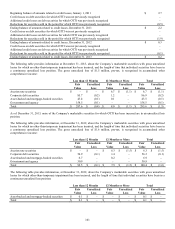
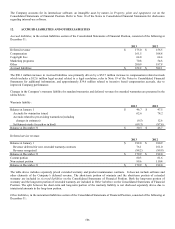
Beginning balance of amounts related to credit losses, January 1, 2011 $ 2.7
Credit losses on debt securities for which OTTI was not previously recognized –
Additional credit losses on debt securities for which OTTI was previously recognized –
Reductions for securities sold in the period for which OTTI was previously recognized (0.5)
Ending balance of amounts related to credit losses, December 31, 2011 $ 2.2
Credit losses on debt securities for which OTTI was not previously recognized –
Additional credit losses on debt securities for which OTTI was previously recognized –
Reductions for securities sold in the period for which OTTI was previously recognized (1.9)
Ending balance of amounts related to credit losses, December 31, 2012 $ 0.3
Credit losses on debt securities for which OTTI was not previously recognized –
Additional credit losses on debt securities for which OTTI was previously recognized –
Reductions for securities sold in the period for which OTTI was previously recognized (0.1)
Ending balance of amounts related to credit losses, December 31, 2013 $ 0.2
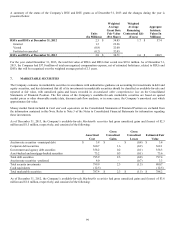
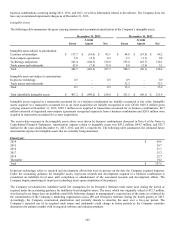
The following table provides information at December 31, 2013, about the Company’s marketable securities with gross unrealized
losses for which no other-than-temporary impairment has been incurred, and the length of time that individual securities have been in
a continuous unrealized loss position. The gross unrealized loss of $1.5 million, pre-tax, is recognized in accumulated other
comprehensive income:
Less than 12 Months 12 Months or More Total
Fair Unrealized Fair Unrealized Fair Unrealized
Value Loss Value Loss Value Loss
Auction rate securities $ – $ – $ 6.7 $ (1.1) $ 6.7 $ (1.1)
Corporate debt securities 85.7 (0.2) 1.2 – 86.9 (0.2)
Asset-backed and mortgage-backed securities 43.4 (0.1) 0.1 – 43.5 (0.1)
Government and agency 158.5 (0.1) – – 158.5 (0.1)
Total $ 287.6 $ (0.4) $ 8.0 $ (1.1) $ 295.6 $ (1.5)
As of December 31, 2013, none of the Company's marketable securities for which OTTI has been incurred are in an unrealized loss
position.
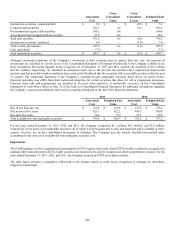
The following table provides information, at December 31, 2012, about the Company’s marketable securities with gross unrealized
losses for which no other-than-temporary impairment has been incurred, and the length of time that individual securities have been in
a continuous unrealized loss position. The gross unrealized loss of $1.6 million, pre-tax, is recognized in accumulated other
comprehensive income:
Less than 12 Months 12 Months or More Total
Fair Unrealized Fair Unrealized Fair Unrealized
Value Loss Value Loss Value Loss
Auction rate securities $ – $ – $ 6.3 $ (1.5) $ 6.3 $ (1.5)
Corporate debt securities 54.9 (0.1) 1.4 – 56.3 (0.1)
Asset-backed and mortgage-backed securities 6.7 – 0.2 – 6.9 –
Government and agency 30.9 – – – 30.9 –
Total $ 92.5 $ (0.1) $ 7.9 $ (1.5) $ 100.4 $ (1.6)
The following table provides information, at December 31, 2012, about the Company’s marketable securities with gross unrealized
losses for which other-than-temporary impairment has been incurred, and the length of time that individual securities have been in a
continuous unrealized loss position:
Less than 12 Months 12 Months or More Total
Fair Unrealized Fair Unrealized Fair Unrealized
Value Loss Value Loss Value Loss
Asset-backed and mortgage-backed securities $ 0.1 $ – $ – $ – $ 0.1 $ –
Total $ 0.1 $ – $ – $ – $ 0.1 $ –
101