Lexmark 2013 Annual Report Download - page 101
Download and view the complete annual report
Please find page 101 of the 2013 Lexmark annual report below. You can navigate through the pages in the report by either clicking on the pages listed below, or by using the keyword search tool below to find specific information within the annual report.-
 1
1 -
2
-
3
-
4
-
5
-
6
-
7
-
8
-
9
-
10
-
11
-
12
-
13
-
14
-
15
-
16
-
17
-
18
-
19
-
20
-
21
-
22
-
23
-
24
-
25
-
26
-
27
-
28
-
29
-
30
-
31
-
32
-
33
-
34
-
35
-
36
-
37
-
38
-
39
-
40
-
41
-
42
-
43
-
44
-
45
-
46
-
47
-
48
-
49
-
50
-
51
-
52
-
53
-
54
-
55
-
56
-
57
-
58
-
59
-
60
-
61
-
62
-
63
-
64
-
65
-
66
-
67
-
68
-
69
-
70
-
71
-
72
-
73
-
74
-
75
-
76
-
77
-
78
-
79
-
80
-
81
-
82
-
83
-
84
-
85
-
86
-
87
-
88
-
89
-
90
-
 91
91 -
 92
92 -
 93
93 -
 94
94 -
 95
95 -
 96
96 -
 97
97 -
 98
98 -
 99
99 -
 100
100 -
 101
101 -
 102
102 -
 103
103 -
 104
104 -
 105
105 -
 106
106 -
 107
107 -
 108
108 -
 109
109 -
 110
110 -
 111
111 -
112
-
113
-
114
-
115
-
116
-
117
-
118
-
119
-
120
-
121
-
122
-
123
-
124
-
125
-
126
-
127
-
128
-
129
-
130
-
131
-
132
-
133
-
134
-
135
-
136
-
137
-
138
-
139
-
140
-
141
-
142
-
143
-
144
-
145
-
146
-
147
-
148
-
149
-
150
-
151
-
152
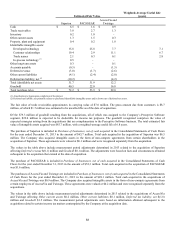
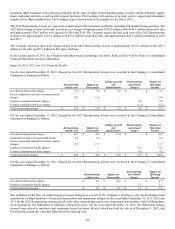
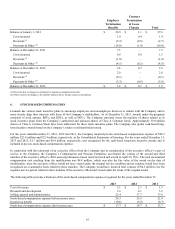
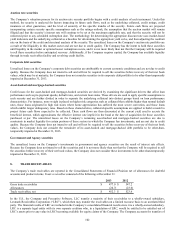
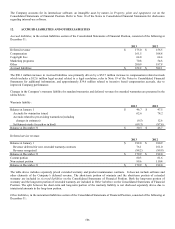
 |
 |

Contract
Employee Termination
Termination & Lease
Benefits Charges Total
Balance at January 1, 2011 $ 26.5 $ 1.1 $ 27.6
Costs incurred 1.0 0.4 1.4
Reversals (1) (2.2) (0.5) (2.7)
Payments & Other (2) (18.0) (1.0) (19.0)
Balance at December 31, 2011 7.3 – 7.3
Costs incurred 0.6 0.9 1.5
Reversals (1) (1.0) – (1.0)
Payments & Other (2) (4.1) (0.2) (4.3)
Balance at December 31, 2012 2.8 0.7 3.5
Costs incurred 2.0 – 2.0
Reversals (1) (0.1) – (0.1)
Payments & Other (2) (3.3) (0.6) (3.9)
Balance at December 31, 2013 $ 1.4 $ 0.1 $ 1.5
(1) Reversals due to changes in estimates for employee termination benefits.
(2) Other consists of changes in the liability balance due to foreign currency translations.
6. STOCK-BASED COMPENSATION
Lexmark has various stock incentive plans to encourage employees and nonemployee directors to remain with the Company and to
more closely align their interests with those of the Company’s stockholders. As of December 31, 2013, awards under the programs
consisted of stock options, RSUs, and DSUs, as well as DEUs. The Company currently issues the majority of shares related to its
stock incentive plans from the Company’s authorized and unissued shares of Class A Common Stock. Approximately 59.0 million
shares of Class A Common Stock have been authorized for these stock incentive plans. The Company also grants cash-based long-
term incentive awards based on the Company’s relative total shareholder return.
For the years ended December 31, 2013, 2012 and 2011, the Company incurred pre-tax stock-based compensation expense of $28.3
million, $23.9 million and $22.4 million, respectively, in the Consolidated Statements of Earnings. For the years ended December 31,
2013 and 2012, $1.7 million and $0.4 million, respectively, was recognized for the cash-based long-term incentive awards and is
included in pre-tax stock-based compensation expense.
In connection with the retirement of an executive officer from the Company and in consideration of the executive officer’s years of
service to the Company, the Company’s Compensation and Pension Committee accelerated the vesting of the second and third
tranches of the executive officer’s 2010 earned performance-based restricted stock unit award to April 29, 2011. The total incremental
compensation cost resulting from the modification was $4.8 million, which was also the fair value of the award on the date of
modification, since the executive officer would not have vested under the original service condition and no expense would have been
recognized on a cumulative basis related to these tranches. The Company would have incurred total expense of $4.3 million over the
requisite service period related to these tranches if the executive officer had vested under the terms of the original award.
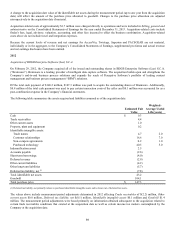
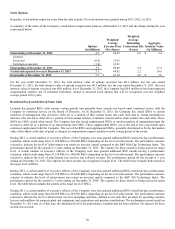
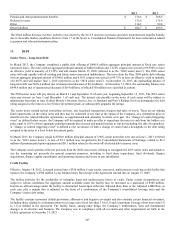
The following table presents a breakout of the stock-based compensation expense recognized for the years ended December 31:
2013 2012 2011
Cost of revenue $ 2.3 $ 2.1 $ 1.3
Research and development 3.6 4.1 3.5
Selling, general and administrative 22.4 17.7 17.6
Stock-based compensation expense before income taxes 28.3 23.9 22.4
Income tax benefit (10.6) (9.2) (8.7)
Stock-based compensation expense after income taxes $ 17.7 $ 14.7 $ 13.7
97