Lenovo 2015 Annual Report Download - page 95
Download and view the complete annual report
Please find page 95 of the 2015 Lenovo annual report below. You can navigate through the pages in the report by either clicking on the pages listed below, or by using the keyword search tool below to find specific information within the annual report.-
 1
1 -
2
-
3
-
4
-
5
-
6
-
7
-
8
-
9
-
10
-
11
-
12
-
13
-
14
-
15
-
16
-
17
-
18
-
19
-
20
-
21
-
22
-
23
-
24
-
25
-
26
-
27
-
28
-
29
-
30
-
31
-
32
-
33
-
34
-
35
-
36
-
37
-
38
-
39
-
40
-
41
-
42
-
43
-
44
-
45
-
46
-
47
-
48
-
49
-
50
-
51
-
52
-
53
-
54
-
55
-
56
-
57
-
58
-
59
-
60
-
61
-
62
-
63
-
64
-
65
-
66
-
67
-
68
-
69
-
70
-
71
-
72
-
73
-
74
-
75
-
76
-
77
-
78
-
79
-
80
-
81
-
82
-
83
-
84
-
 85
85 -
 86
86 -
 87
87 -
 88
88 -
 89
89 -
 90
90 -
 91
91 -
 92
92 -
 93
93 -
 94
94 -
 95
95 -
 96
96 -
 97
97 -
 98
98 -
 99
99 -
 100
100 -
 101
101 -
 102
102 -
 103
103 -
 104
104 -
 105
105 -
106
-
107
-
108
-
109
-
110
-
111
-
112
-
113
-
114
-
115
-
116
-
117
-
118
-
119
-
120
-
121
-
122
-
123
-
124
-
125
-
126
-
127
-
128
-
129
-
130
-
131
-
132
-
133
-
134
-
135
-
136
-
137
-
138
-
139
-
140
-
141
-
142
-
143
-
144
-
145
-
146
-
147
-
148
-
149
-
150
-
151
-
152
-
153
-
154
-
155
-
156
-
157
-
158
-
159
-
160
-
161
-
162
-
163
-
164
-
165
-
166
-
167
-
168
-
169
-
170
-
171
-
172
-
173
-
174
-
175
-
176
-
177
-
178
-
179
-
180
-
181
-
182
-
183
-
184
-
185
-
186
-
187
-
188
-
189
-
190
-
191
-
192
-
193
-
194
-
195
-
196
-
197
-
198
-
199
-
200
-
201
-
202
-
203
-
204
-
205
-
206
-
207
-
208
-
209
-
210
-
211
-
212
-
213
-
214
-
215
 |
 |

93
2014/15 Annual Report Lenovo Group Limited
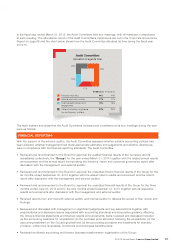
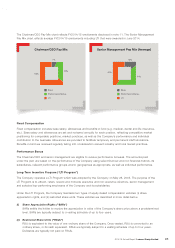
The Chairman/CEO Pay Mix chart reflects FY2014/15 emoluments disclosed in note 11. The Senior Management
Pay Mix chart reflects average FY2014/15 emoluments including LTI that were awarded in June 2014.
Chairman/CEO Pay Mix Senior Management Pay Mix (Average)
Performance Bonus
Base
LTI
Performance Bonus
Base
LTI
7% 16%
28%
65%
44%
40%
Fixed Compensation
Fixed compensation includes base salary, allowances and benefits-in-kind (e.g. medical, dental and life insurance,
etc.). Base salary and allowances are set and reviewed annually for each position, reflecting competitive market
positioning for comparable positions, market practices, as well as the Company’s performance and individual
contribution to the business. Allowances are provided to facilitate temporary and permanent staff relocations.
Benefits-in-kind are reviewed regularly taking into consideration relevant industry and local market practices.
Performance Bonus
The Chairman/CEO and senior management are eligible to receive performance bonuses. The amounts paid
under the plan are based on the performance of the Company using select financial and non-financial metrics, its
subsidiaries, relevant performance groups and/or geographies as appropriate, as well as individual performance.
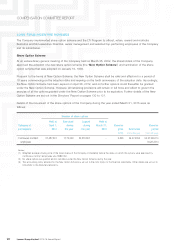
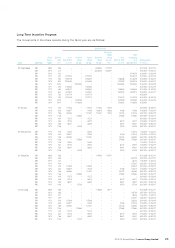
Long-Term Incentive Program (“LTI Program”)
The Company operates a LTI Program which was adopted by the Company on May 26, 2005. The purpose of the
LTI Program is to attract, retain, reward and motivate executive and non-executive directors, senior management
and selected top-performing employees of the Company and its subsidiaries.
Under the LTI Program, the Company maintains two types of equity-based compensation vehicles: (i) share
appreciation rights, and (ii) restricted share units. These vehicles are described in more detail below.
(i) Share Appreciation Rights (“SARs”)
SARs entitle the holder to receive the appreciation in value of the Company’s share price above a predetermined
level. SARs are typically subject to a vesting schedule of up to four years.
(ii) Restricted Share Units (“RSUs”)
RSU is equivalent to the value of one ordinary share of the Company. Once vested, RSU is converted to an
ordinary share, or its cash equivalent. RSUs are typically subject to a vesting schedule of up to four years.
Dividends are typically not paid on RSUs.