Lenovo 2015 Annual Report Download - page 20
Download and view the complete annual report
Please find page 20 of the 2015 Lenovo annual report below. You can navigate through the pages in the report by either clicking on the pages listed below, or by using the keyword search tool below to find specific information within the annual report.-
 1
1 -
2
-
3
-
4
-
5
-
6
-
7
-
8
-
9
-
 10
10 -
 11
11 -
 12
12 -
 13
13 -
 14
14 -
 15
15 -
 16
16 -
 17
17 -
 18
18 -
 19
19 -
 20
20 -
 21
21 -
 22
22 -
 23
23 -
 24
24 -
 25
25 -
 26
26 -
 27
27 -
 28
28 -
 29
29 -
 30
30 -
31
-
32
-
33
-
34
-
35
-
36
-
37
-
38
-
39
-
40
-
41
-
42
-
43
-
44
-
45
-
46
-
47
-
48
-
49
-
50
-
51
-
52
-
53
-
54
-
55
-
56
-
57
-
58
-
59
-
60
-
61
-
62
-
63
-
64
-
65
-
66
-
67
-
68
-
69
-
70
-
71
-
72
-
73
-
74
-
75
-
76
-
77
-
78
-
79
-
80
-
81
-
82
-
83
-
84
-
85
-
86
-
87
-
88
-
89
-
90
-
91
-
92
-
93
-
94
-
95
-
96
-
97
-
98
-
99
-
100
-
101
-
102
-
103
-
104
-
105
-
106
-
107
-
108
-
109
-
110
-
111
-
112
-
113
-
114
-
115
-
116
-
117
-
118
-
119
-
120
-
121
-
122
-
123
-
124
-
125
-
126
-
127
-
128
-
129
-
130
-
131
-
132
-
133
-
134
-
135
-
136
-
137
-
138
-
139
-
140
-
141
-
142
-
143
-
144
-
145
-
146
-
147
-
148
-
149
-
150
-
151
-
152
-
153
-
154
-
155
-
156
-
157
-
158
-
159
-
160
-
161
-
162
-
163
-
164
-
165
-
166
-
167
-
168
-
169
-
170
-
171
-
172
-
173
-
174
-
175
-
176
-
177
-
178
-
179
-
180
-
181
-
182
-
183
-
184
-
185
-
186
-
187
-
188
-
189
-
190
-
191
-
192
-
193
-
194
-
195
-
196
-
197
-
198
-
199
-
200
-
201
-
202
-
203
-
204
-
205
-
206
-
207
-
208
-
209
-
210
-
211
-
212
-
213
-
214
-
215
 |
 |

18 Lenovo Group Limited 2014/15 Annual Report
MANAGEMENT’S DISCUSSION & ANALYSIS
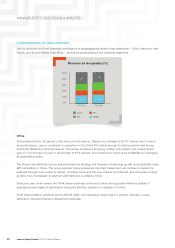
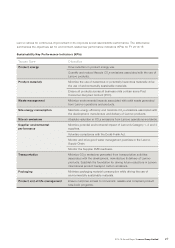
PERFORMANCE OF PRODUCT BUSINESS GROUPS
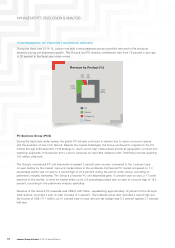
During the fiscal year 2014/15, Lenovo has built a more balanced product portfolio and each of its products
achieved strong unit shipments growth. The Group’s non PC revenue contribution rose from 18 percent a year ago
to 28 percent in the fiscal year under review.
Revenue by Product (%)
2%
(3%)
6%
(1%)
72%
(82%)
20%
(14%)
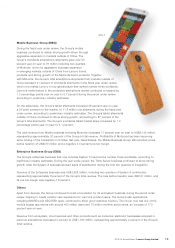
Mobile
Enterprise
PC
Others
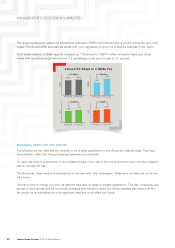
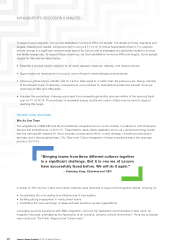
PC Business Group (PCG)
During the fiscal year under review, the global PC industry continued to decline due to macro-economic issues
and the evolution of new form factors. Despite the market challenges, the Group continued to outperform the PC
market through solid execution of its strategy to reach record-high market share across all geographic, product and
customer segments. In December 2014, Lenovo achieved an important milestone with ThinkPad products reaching
100 million units sold.
The Group’s commercial PC unit shipments increased 3 percent year-on-year, compared to the 3 percent year-
on-year decline by the market. Lenovo’s market share in the worldwide commercial PC market increased by 1.3
percentage points year-on-year to a record high of 20.9 percent during the period under review, according to
preliminary industry estimates. The Group’s consumer PC unit shipments grew 15 percent year-on-year, a 17-point
premium to the market, to drive its market share up by 2.8 percentage points year-on-year to a record high of 18.5
percent, according to the preliminary industry estimates.
Revenue of the Group’s PC business was US$33,346 million, representing approximately 72 percent of the Group’s
total revenue, recorded a year-on-year increase of 5 percent. The business group also recorded a record high pre-
tax income of US$1,771 million, up 51 percent year-on-year and pre-tax margin was 5.3 percent against 3.7 percent
last year.