Lenovo 2015 Annual Report Download - page 147
Download and view the complete annual report
Please find page 147 of the 2015 Lenovo annual report below. You can navigate through the pages in the report by either clicking on the pages listed below, or by using the keyword search tool below to find specific information within the annual report.-
 1
1 -
2
-
3
-
4
-
5
-
6
-
7
-
8
-
9
-
10
-
11
-
12
-
13
-
14
-
15
-
16
-
17
-
18
-
19
-
20
-
21
-
22
-
23
-
24
-
25
-
26
-
27
-
28
-
29
-
30
-
31
-
32
-
33
-
34
-
35
-
36
-
37
-
38
-
39
-
40
-
41
-
42
-
43
-
44
-
45
-
46
-
47
-
48
-
49
-
50
-
51
-
52
-
53
-
54
-
55
-
56
-
57
-
58
-
59
-
60
-
61
-
62
-
63
-
64
-
65
-
66
-
67
-
68
-
69
-
70
-
71
-
72
-
73
-
74
-
75
-
76
-
77
-
78
-
79
-
80
-
81
-
82
-
83
-
84
-
85
-
86
-
87
-
88
-
89
-
90
-
91
-
92
-
93
-
94
-
95
-
96
-
97
-
98
-
99
-
100
-
101
-
102
-
103
-
104
-
105
-
106
-
107
-
108
-
109
-
110
-
111
-
112
-
113
-
114
-
115
-
116
-
117
-
118
-
119
-
120
-
121
-
122
-
123
-
124
-
125
-
126
-
127
-
128
-
129
-
130
-
131
-
132
-
133
-
134
-
135
-
136
-
 137
137 -
 138
138 -
 139
139 -
 140
140 -
 141
141 -
 142
142 -
 143
143 -
 144
144 -
 145
145 -
 146
146 -
 147
147 -
 148
148 -
 149
149 -
 150
150 -
 151
151 -
 152
152 -
 153
153 -
 154
154 -
 155
155 -
 156
156 -
 157
157 -
158
-
159
-
160
-
161
-
162
-
163
-
164
-
165
-
166
-
167
-
168
-
169
-
170
-
171
-
172
-
173
-
174
-
175
-
176
-
177
-
178
-
179
-
180
-
181
-
182
-
183
-
184
-
185
-
186
-
187
-
188
-
189
-
190
-
191
-
192
-
193
-
194
-
195
-
196
-
197
-
198
-
199
-
200
-
201
-
202
-
203
-
204
-
205
-
206
-
207
-
208
-
209
-
210
-
211
-
212
-
213
-
214
-
215
 |
 |

145
2014/15 Annual Report Lenovo Group Limited
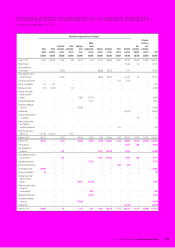
CONSOLIDATED STATEMENT OF CHANGES IN EQUITY
For the year ended March 31, 2015
Attributable to equity holders of the Company
Share
capital
Share
premium
Investment
revaluation
reserve
Share
redemption
reserve
Employee
share
trusts
Share-
based
compensation
reserve
Hedging
reserve
Exchange
reserve
Other
reserve
Retained
earnings
Non-
controlling
interests
Put option
written on
non-
controlling
interest Total
US$’000 US$’000 US$’000 US$’000 US$’000 US$’000 US$’000 US$’000 US$’000 US$’000 US$’000 US$’000 US$’000
At April 1, 2013 33,465 1,654,806 16,080 1,188 (22,197) (3,149) 35,079 (166,850) 64,457 1,053,764 226,438 (212,900) 2,680,181
Profit for the year ––––– ––––817,228 242 –817,470
Other comprehensive
(loss)/income – – (22,814) – – – (38,288) (68,531) –4,177 – – (125,456)
Total comprehensive (loss)/
income for the year – – (22,814) – – – (38,288) (68,531) –821,405 242 –692,014
Transfer to statutory reserve ––––– –––2,379 (2,379) –––
Exercise of share options 816 5,130 ––– –––––––5,946
Repurchase of shares (164) (45,304) –164 – –––––––(45,304)
Vesting of shares under
long-term incentive
program ––––73,882 (100,747) ––––––(26,865)
Share-based compensation –––––80,274 ––––––80,274
Contribution to employee
share trusts – – – – (100,688) –––––––(100,688)
Dividends paid ––––– ––––(266,692) – – (266,692)
Change in ownership interest
in a subsidiary ––––– –––––810 –810
Release of escrow shares
for settlement of
acquisition consideration ––––– –––5,044 –––5,044
Transfer to share capital
(Note 29, 30) 1,615,984 (1,614,632) –(1,352) – ––––––––
At March 31, 2014 1,650,101 –(6,734) –(49,003) (23,622) (3,209) (235,381) 71,880 1,606,098 227,490 (212,900) 3,024,720
At April 1, 2014 1,650,101 –(6,734) –(49,003) (23,622) (3,209) (235,381) 71,880 1,606,098 227,490 (212,900) 3,024,720
Profit for the year ––––– ––––828,715 7,888 –836,603
Other comprehensive
income/(loss) – – 7,326 – – – 121,291 (598,733) –(68,973) – – (539,089)
Total comprehensive income/
(loss) for the year – – 7,326 – – – 121,291 (598,733) –759,742 7,888 –297,514
Acquisition of businesses –––––121,252 ––––––121,252
Transfer to statutory reserve ––––– –––3,832 (3,832) –––
Issue of ordinary shares 1,039,396 –––– –––––––1,039,396
Exercise of share options 385 –––– –––––––385
Vesting of shares under
long-term incentive
program ––––166,927 (237,448) ––––––(70,521)
Deferred tax credit in relation
to long-term
incentive program –––––9,693 ––––––9,693
Share-based compensation –––––139,977 ––––––139,977
Contribution to employee
share trusts ––––(129,365) –––––––(129,365)
Dividends paid ––––– ––––(326,930) – – (326,930)
At March 31, 2015 2,689,882 –592 –(11,441) 9,852 118,082 (834,114) 75,712 2,035,078 235,378 (212,900) 4,106,121