Lenovo 2015 Annual Report Download - page 185
Download and view the complete annual report
Please find page 185 of the 2015 Lenovo annual report below. You can navigate through the pages in the report by either clicking on the pages listed below, or by using the keyword search tool below to find specific information within the annual report.-
 1
1 -
2
-
3
-
4
-
5
-
6
-
7
-
8
-
9
-
10
-
11
-
12
-
13
-
14
-
15
-
16
-
17
-
18
-
19
-
20
-
21
-
22
-
23
-
24
-
25
-
26
-
27
-
28
-
29
-
30
-
31
-
32
-
33
-
34
-
35
-
36
-
37
-
38
-
39
-
40
-
41
-
42
-
43
-
44
-
45
-
46
-
47
-
48
-
49
-
50
-
51
-
52
-
53
-
54
-
55
-
56
-
57
-
58
-
59
-
60
-
61
-
62
-
63
-
64
-
65
-
66
-
67
-
68
-
69
-
70
-
71
-
72
-
73
-
74
-
75
-
76
-
77
-
78
-
79
-
80
-
81
-
82
-
83
-
84
-
85
-
86
-
87
-
88
-
89
-
90
-
91
-
92
-
93
-
94
-
95
-
96
-
97
-
98
-
99
-
100
-
101
-
102
-
103
-
104
-
105
-
106
-
107
-
108
-
109
-
110
-
111
-
112
-
113
-
114
-
115
-
116
-
117
-
118
-
119
-
120
-
121
-
122
-
123
-
124
-
125
-
126
-
127
-
128
-
129
-
130
-
131
-
132
-
133
-
134
-
135
-
136
-
137
-
138
-
139
-
140
-
141
-
142
-
143
-
144
-
145
-
146
-
147
-
148
-
149
-
150
-
151
-
152
-
153
-
154
-
155
-
156
-
157
-
158
-
159
-
160
-
161
-
162
-
163
-
164
-
165
-
166
-
167
-
168
-
169
-
170
-
171
-
172
-
173
-
174
-
 175
175 -
 176
176 -
 177
177 -
 178
178 -
 179
179 -
 180
180 -
 181
181 -
 182
182 -
 183
183 -
 184
184 -
 185
185 -
 186
186 -
 187
187 -
 188
188 -
 189
189 -
 190
190 -
 191
191 -
 192
192 -
 193
193 -
 194
194 -
 195
195 -
196
-
197
-
198
-
199
-
200
-
201
-
202
-
203
-
204
-
205
-
206
-
207
-
208
-
209
-
210
-
211
-
212
-
213
-
214
-
215
 |
 |

183
2014/15 Annual Report Lenovo Group Limited
NOTES TO THE FINANCIAL STATEMENTS
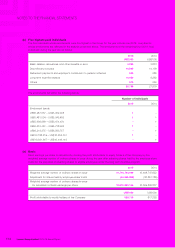
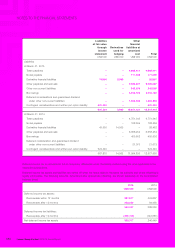
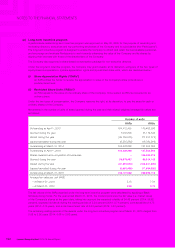
20 DEFERRED INCOME TAX ASSETS AND LIABILITIES (continued)
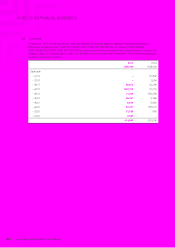
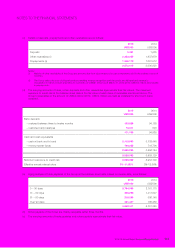
The movements in the net deferred income tax assets are as follows:
2015 2014
US$’000 US$’000
At the beginning of the year 246,449 235,397
Reclassification and exchange adjustment (4,814) (9,496)
Credited to consolidated income statement (Note 9) 85,487 17,474
(Charged)/credited to other comprehensive income (Note 9) (3,451) 3,290
Acquisition of businesses/subsidiaries (4,047) (216)
Credited to share-based compensation reserve 9,693 –
At the end of the year 329,317 246,449
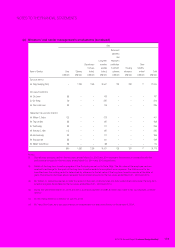
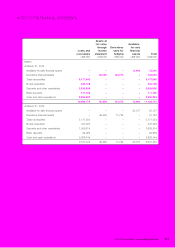
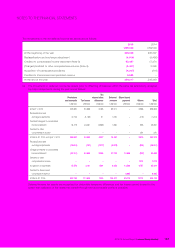
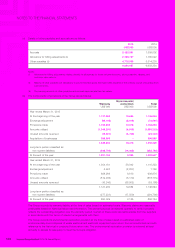
(a) The movements in deferred income tax assets (prior to offsetting of balances within the same tax jurisdiction), analyzed
by major components, during the year are as follows:
Provisions
and accruals Tax losses
Tax
depreciation
allowance
Deferred
revenue
Share-based
payment Others Total
US$’000 US$’000 US$’000 US$’000 US$’000 US$’000 US$’000
At April 1, 2013 245,892 30,686 6,086 65,574 –5,588 353,826
Reclassification and
exchange adjustments (4,750) (3,185) 57 1,094 –(416) (7,200)
Credited/(charged) to consolidated
income statement 18,479 23,081 (3,936) 7,682 –355 45,661
Credited to other
comprehensive income –––––291 291
At March 31, 2014 and April 1, 2014 259,621 50,582 2,207 74,350 –5,818 392,578
Reclassification and
exchange adjustments (18,604) (747) (1,017) (5,408) –(505) (26,281)
(Charged)/credited to consolidated
income statement (33,101) 64,699 5,059 27,703 16,646 (320) 80,686
Credited to other
comprehensive income –––––1,012 1,012
Acquisition of businesses 15,876 3,101 1,294 8,626 43,380 9,767 82,044
Credited to share-based
compensation reserve ––––9,693 –9,693
At March 31, 2015 223,792 117,635 7,543 105,271 69,719 15,772 539,732
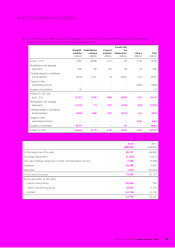
Deferred income tax assets are recognized for deductible temporary differences and tax losses carried forward to the
extent that realization of the related tax benefit through the future taxable profits is probable.