Lenovo 2015 Annual Report Download - page 101
Download and view the complete annual report
Please find page 101 of the 2015 Lenovo annual report below. You can navigate through the pages in the report by either clicking on the pages listed below, or by using the keyword search tool below to find specific information within the annual report.-
 1
1 -
2
-
3
-
4
-
5
-
6
-
7
-
8
-
9
-
10
-
11
-
12
-
13
-
14
-
15
-
16
-
17
-
18
-
19
-
20
-
21
-
22
-
23
-
24
-
25
-
26
-
27
-
28
-
29
-
30
-
31
-
32
-
33
-
34
-
35
-
36
-
37
-
38
-
39
-
40
-
41
-
42
-
43
-
44
-
45
-
46
-
47
-
48
-
49
-
50
-
51
-
52
-
53
-
54
-
55
-
56
-
57
-
58
-
59
-
60
-
61
-
62
-
63
-
64
-
65
-
66
-
67
-
68
-
69
-
70
-
71
-
72
-
73
-
74
-
75
-
76
-
77
-
78
-
79
-
80
-
81
-
82
-
83
-
84
-
85
-
86
-
87
-
88
-
89
-
90
-
 91
91 -
 92
92 -
 93
93 -
 94
94 -
 95
95 -
 96
96 -
 97
97 -
 98
98 -
 99
99 -
 100
100 -
 101
101 -
 102
102 -
 103
103 -
 104
104 -
 105
105 -
 106
106 -
 107
107 -
 108
108 -
 109
109 -
 110
110 -
 111
111 -
112
-
113
-
114
-
115
-
116
-
117
-
118
-
119
-
120
-
121
-
122
-
123
-
124
-
125
-
126
-
127
-
128
-
129
-
130
-
131
-
132
-
133
-
134
-
135
-
136
-
137
-
138
-
139
-
140
-
141
-
142
-
143
-
144
-
145
-
146
-
147
-
148
-
149
-
150
-
151
-
152
-
153
-
154
-
155
-
156
-
157
-
158
-
159
-
160
-
161
-
162
-
163
-
164
-
165
-
166
-
167
-
168
-
169
-
170
-
171
-
172
-
173
-
174
-
175
-
176
-
177
-
178
-
179
-
180
-
181
-
182
-
183
-
184
-
185
-
186
-
187
-
188
-
189
-
190
-
191
-
192
-
193
-
194
-
195
-
196
-
197
-
198
-
199
-
200
-
201
-
202
-
203
-
204
-
205
-
206
-
207
-
208
-
209
-
210
-
211
-
212
-
213
-
214
-
215
 |
 |

99
2014/15 Annual Report Lenovo Group Limited
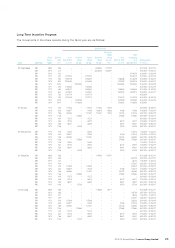
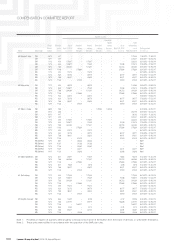
Long-Term Incentive Program
The movements in the share awards during the fiscal year are as follows:
Number of units
Name Award type
Fiscal
Year of
Award
Effective
price
(HK$)
As at
April 1, 2014
(unvested)
Awarded
during
the year
Vested
during
the year
Exercised
during
the year
Cancelled/
lapsed
during
the year
(Note 2)
As at
March 31, 2015
(unvested)
Total
outstanding
as at
March 31, 2015
Vesting period
(mm.dd.yyyy)
Mr. Yang Yuanqing SAR 08/09 5.88 – – – 3,939,855 1,901,999 – – 06.01.2009 – 06.01.2012
SAR 09/10 3.17 – – – 22,800,000 5,933,991 – – 05.25.2010 – 05.25.2013
SAR 09/10 5.23 – – – – – – 6,596,156 02.08.2011 – 02.08.2014
SAR 10/11 4.92 2,757,554 –2,757,554 – – – 11,030,219 02.21.2012 – 02.21.2015
SAR 11/12 6.80 5,566,178 –2,783,090 – – 2,783,088 11,132,358 02.13.2013 – 02.13.2016
SAR 12/13 8.22 10,544,680 –3,514,893 – – 7,029,787 14,059,573 02.04.2014 – 02.04.2017
SAR 13/14 9.815 –14,520,062 – – – 14,520,062 14,520,062 06.03.2015 – 06.03.2018
RSU 10/11 4.92 1,969,682 –1,969,682 – – – – 02.21.2012 – 02.21.2015
RSU 11/12 6.80 3,339,707 –1,669,854 – – 1,669,853 1,669,853 02.13.2013 – 02.13.2016
RSU 12/13 8.22 4,274,870 –1,424,957 – – 2,849,913 2,849,913 02.04.2014 – 02.04.2017
RSU 12/13 7.82 2,164,779 –2,164,779 – – – – 06.03.2014
RSU 12/13 7.82 3,216,329 –1,072,110 – – 2,144,219 2,144,219 06.03.2014 – 06.03.2016
RSU 13/14 9.815 –5,329,589 – – – 5,329,589 5,329,589 06.03.2015 – 06.03.2018
RSU 13/14 9.815 –1,423,663 – – – 1,423,663 1,423,663 06.03.2015
Mr. Zhu Linan SAR 11/12 4.56 107,666 –107,666 107,666 40,676 – – 08.19.2012 – 08.19.2014
SAR 12/13 6.36 182,877 –91,439 182,878 96,363 91,438 91,438 07.03.2013 – 07.03.2015
SAR 13/14 7.88 364,084 –121,361 121,361 79,232 242,723 242,723 08.16.2014 – 08.16.2016
SAR 14/15 11.48 –275,884 – – – 275,884 275,884 08.15.2015 – 08.15.2017
RSU 11/12 4.56 51,270 –51,270 – – – – 08.19.2012 – 08.19.2014
RSU 12/13 6.36 73,153 –36,576 – – 36,577 36,577 07.03.2013 – 07.03.2015
RSU 13/14 7.88 98,401 –32,800 – – 65,601 65,601 08.16.2014 – 08.16.2016
RSU 14/15 11.48 –67,509 – – – 67,509 67,509 08.15.2015 – 08.15.2017
Mr. Zhao John Huan SAR 11/12 5.78 34,637 –34,637 – – – 103,913 11.03.2012 – 11.03.2014
SAR 12/13 6.36 182,877 –91,439 – – 91,438 274,316 07.03.2013 – 07.03.2015
SAR 13/14 7.88 364,084 –121,361 – – 242,723 364,084 08.16.2014 – 08.16.2016
SAR 14/15 11.48 –275,884 – – – 275,884 275,884 08.15.2015 – 08.15.2017
RSU 11/12 5.78 16,494 –16,494 – – – – 11.03.2012 – 11.03.2014
RSU 12/13 6.36 73,153 –36,576 – – 36,577 36,577 07.03.2013 – 07.03.2015
RSU 13/14 7.88 98,401 –32,800 – – 65,601 65,601 08.16.2014 – 08.16.2016
RSU 14/15 11.48 –67,509 – – – 67,509 67,509 08.15.2015 – 08.15.2017
Mr. Ting Lee Sen SAR 08/09 5.88 – – – 195,980 104,571 – – 06.01.2009 – 06.01.2011
SAR 09/10 3.88 – – – – – – 263,796 08.07.2010 – 08.07.2012
SAR 09/10 4.47 – – – – – – 38,163 11.30.2010 – 11.30.2012
SAR 10/11 4.59 – – – – – – 237,001 08.20.2011 – 08.20.2013
SAR 11/12 4.56 107,666 –107,666 – – – 323,000 08.19.2012 – 08.19.2014
SAR 12/13 6.36 182,877 –91,439 – – 91,438 274,316 07.03.2013 – 07.03.2015
SAR 13/14 7.88 364,084 –121,361 – – 242,723 364,084 08.16.2014 – 08.16.2016
SAR 14/15 11.48 –275,884 – – – 275,884 275,884 08.15.2015 – 08.15.2017
RSU 11/12 4.56 51,270 –51,270 – – – – 08.19.2012 – 08.19.2014
RSU 12/13 6.36 73,153 –36,576 – – 36,577 36,577 07.03.2013 – 07.03.2015
RSU 13/14 7.88 98,401 –32,800 – – 65,601 65,601 08.16.2014 – 08.16.2016
RSU 14/15 11.48 –67,509 – – – 67,509 67,509 08.15.2015 – 08.15.2017
Dr. Tian Suning SAR 08/09 5.88 – – – 195,980 96,111 – – 06.01.2009 – 06.01.2011
SAR 09/10 3.88 – – – – – – 263,796 08.07.2010 – 08.07.2012
SAR 09/10 4.47 – – – – – – 38,163 11.30.2010 – 11.30.2012
SAR 10/11 4.59 – – – – – – 237,001 08.20.2011 – 08.20.2013
SAR 11/12 4.56 107,666 –107,666 – – – 323,000 08.19.2012 – 08.19.2014
SAR 12/13 6.36 182,877 –91,439 – – 91,438 274,316 07.03.2013 – 07.03.2015
SAR 13/14 7.88 364,084 –121,361 – – 242,723 364,084 08.16.2014 – 08.16.2016
SAR 14/15 11.48 –275,884 – – – 275,884 275,884 08.15.2015 – 08.15.2017
RSU 11/12 4.56 51,270 –51,270 – – – – 08.19.2012 – 08.19.2014
RSU 12/13 6.36 73,153 –36,576 – – 36,577 36,577 07.03.2013 – 07.03.2015
RSU 13/14 7.88 98,401 –32,800 – – 65,601 65,601 08.16.2014 – 08.16.2016
RSU 14/15 11.48 –67,509 – – – 67,509 67,509 08.15.2015 – 08.15.2017