Lenovo 2015 Annual Report Download - page 36
Download and view the complete annual report
Please find page 36 of the 2015 Lenovo annual report below. You can navigate through the pages in the report by either clicking on the pages listed below, or by using the keyword search tool below to find specific information within the annual report.-
 1
1 -
2
-
3
-
4
-
5
-
6
-
7
-
8
-
9
-
10
-
11
-
12
-
13
-
14
-
15
-
16
-
17
-
18
-
19
-
20
-
21
-
22
-
23
-
24
-
25
-
 26
26 -
 27
27 -
 28
28 -
 29
29 -
 30
30 -
 31
31 -
 32
32 -
 33
33 -
 34
34 -
 35
35 -
 36
36 -
 37
37 -
 38
38 -
 39
39 -
 40
40 -
 41
41 -
 42
42 -
 43
43 -
 44
44 -
 45
45 -
 46
46 -
47
-
48
-
49
-
50
-
51
-
52
-
53
-
54
-
55
-
56
-
57
-
58
-
59
-
60
-
61
-
62
-
63
-
64
-
65
-
66
-
67
-
68
-
69
-
70
-
71
-
72
-
73
-
74
-
75
-
76
-
77
-
78
-
79
-
80
-
81
-
82
-
83
-
84
-
85
-
86
-
87
-
88
-
89
-
90
-
91
-
92
-
93
-
94
-
95
-
96
-
97
-
98
-
99
-
100
-
101
-
102
-
103
-
104
-
105
-
106
-
107
-
108
-
109
-
110
-
111
-
112
-
113
-
114
-
115
-
116
-
117
-
118
-
119
-
120
-
121
-
122
-
123
-
124
-
125
-
126
-
127
-
128
-
129
-
130
-
131
-
132
-
133
-
134
-
135
-
136
-
137
-
138
-
139
-
140
-
141
-
142
-
143
-
144
-
145
-
146
-
147
-
148
-
149
-
150
-
151
-
152
-
153
-
154
-
155
-
156
-
157
-
158
-
159
-
160
-
161
-
162
-
163
-
164
-
165
-
166
-
167
-
168
-
169
-
170
-
171
-
172
-
173
-
174
-
175
-
176
-
177
-
178
-
179
-
180
-
181
-
182
-
183
-
184
-
185
-
186
-
187
-
188
-
189
-
190
-
191
-
192
-
193
-
194
-
195
-
196
-
197
-
198
-
199
-
200
-
201
-
202
-
203
-
204
-
205
-
206
-
207
-
208
-
209
-
210
-
211
-
212
-
213
-
214
-
215
 |
 |

34 Lenovo Group Limited 2014/15 Annual Report
MANAGEMENT’S DISCUSSION & ANALYSIS
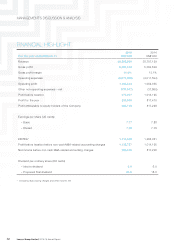
Operating expenses for the year increased by 39% as compared with last year. This is principally attributable to
the operating expenses of US$1,433 million recorded by System X and Motorola following the completion of the
respective acquisitions on October 1 and October 30, 2014. Key expenses by nature comprise:
2015 2014
For the year ended March 31 US$’000 US$’000
Depreciation of property, plant and equipment and amortization
of prepaid lease payments (127,516) (74,472)
Amortization of intangible assets (287,877) (127,163)
Employee benefit costs, including (2,997,614) (2,332,675)
– long-term incentive awards (99,062) (80,274)
Rental expenses under operating leases (88,774) (75,922)
Net foreign exchange loss (189,550) (79,242)
Advertising and promotional expenses (675,760) (554,415)
Others (1,206,208) (767,705)
(5,573,299) (4,011,594)
Depreciation and amortization charges increased by US$214 million which is attributable to the increase in
the business activities of the Group as well as the amounts brought in by System X and Motorola. Additional
amortization of intangible assets in connection with the acquisition of System X and Motorola for the year totaled
US$127 million. The increase in employee benefit costs is in line with the increased headcount as a result of the two
acquisitions and the continuous expanding business operations of the Group. The impact of currency fluctuations
during the year present a challenge, the Group recorded a net exchange loss of US$190 million (2014: US$79
million) for the year.
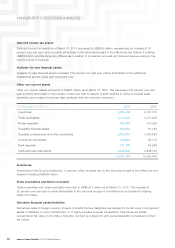
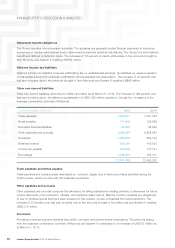
Other non-operating expenses (net) for the year ended March 31, 2015 and 2014 comprise:
2015 2014
For the year ended March 31 US$’000 US$’000
Finance income 30,902 33,893
Finance costs (185,504) (80,974)
Share of profits of associates and joint ventures 17,055 9,221
(137,547) (37,860)
Finance income mainly represents interest on bank deposits.
Finance costs for the year increased by 129 percent as compared with last year. This is mainly attributable to
interest expense of US$65 million in relation to the 5-Year US$1.5 billion notes, issued in May 2014, bearing annual
interest at 4.7% due in May 2019; an increase in factoring costs of US$30 million; and US$17 million interest
expense in relation to promissory note issued to Google Inc.
Share of profits of associates and joint ventures represents operating income arising from principal business
activities of respective associates and joint ventures.