Lenovo 2015 Annual Report Download - page 189
Download and view the complete annual report
Please find page 189 of the 2015 Lenovo annual report below. You can navigate through the pages in the report by either clicking on the pages listed below, or by using the keyword search tool below to find specific information within the annual report.-
 1
1 -
2
-
3
-
4
-
5
-
6
-
7
-
8
-
9
-
10
-
11
-
12
-
13
-
14
-
15
-
16
-
17
-
18
-
19
-
20
-
21
-
22
-
23
-
24
-
25
-
26
-
27
-
28
-
29
-
30
-
31
-
32
-
33
-
34
-
35
-
36
-
37
-
38
-
39
-
40
-
41
-
42
-
43
-
44
-
45
-
46
-
47
-
48
-
49
-
50
-
51
-
52
-
53
-
54
-
55
-
56
-
57
-
58
-
59
-
60
-
61
-
62
-
63
-
64
-
65
-
66
-
67
-
68
-
69
-
70
-
71
-
72
-
73
-
74
-
75
-
76
-
77
-
78
-
79
-
80
-
81
-
82
-
83
-
84
-
85
-
86
-
87
-
88
-
89
-
90
-
91
-
92
-
93
-
94
-
95
-
96
-
97
-
98
-
99
-
100
-
101
-
102
-
103
-
104
-
105
-
106
-
107
-
108
-
109
-
110
-
111
-
112
-
113
-
114
-
115
-
116
-
117
-
118
-
119
-
120
-
121
-
122
-
123
-
124
-
125
-
126
-
127
-
128
-
129
-
130
-
131
-
132
-
133
-
134
-
135
-
136
-
137
-
138
-
139
-
140
-
141
-
142
-
143
-
144
-
145
-
146
-
147
-
148
-
149
-
150
-
151
-
152
-
153
-
154
-
155
-
156
-
157
-
158
-
159
-
160
-
161
-
162
-
163
-
164
-
165
-
166
-
167
-
168
-
169
-
170
-
171
-
172
-
173
-
174
-
175
-
176
-
177
-
178
-
 179
179 -
 180
180 -
 181
181 -
 182
182 -
 183
183 -
 184
184 -
 185
185 -
 186
186 -
 187
187 -
 188
188 -
 189
189 -
 190
190 -
 191
191 -
 192
192 -
 193
193 -
 194
194 -
 195
195 -
 196
196 -
 197
197 -
 198
198 -
 199
199 -
200
-
201
-
202
-
203
-
204
-
205
-
206
-
207
-
208
-
209
-
210
-
211
-
212
-
213
-
214
-
215
 |
 |

187
2014/15 Annual Report Lenovo Group Limited
NOTES TO THE FINANCIAL STATEMENTS
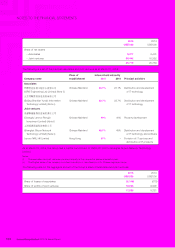
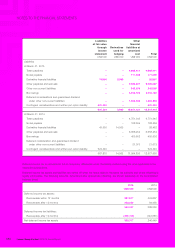
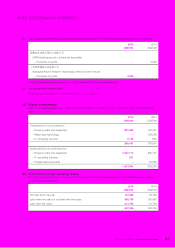
23 RECEIVABLES (continued)
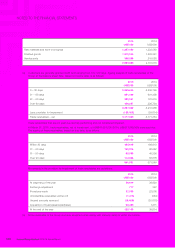
(c) Details of deposits, prepayments and other receivables are as follows:
2015 2014
US$’000 US$’000
Deposits 3,481 1,635
Other receivables (i) 2,322,355 1,937,679
Prepayments (ii) 1,246,179 1,061,512
3,572,015 3,000,826
Notes:
(i) Majority of other receivables of the Group are amounts due from subcontractors for part components sold in the ordinary course of
business.
(ii) The Group defers the cost of shipped products awaiting revenue recognition until the goods are delivered and revenue is
recognized. In-transit product shipments to customers of US$581 million as at March 31, 2015 (2014: US$413 million) are included
in prepayments.
(d) The carrying amounts of trade, notes, deposits and other receivables approximate their fair values. The maximum
exposure to credit risk at the balance sheet date is the fair value of each class of receivable mentioned above. The
Group’s receivables in the amount of US$54 million (2014: US$14 million) are held as collateral for short-term loans
obtained.
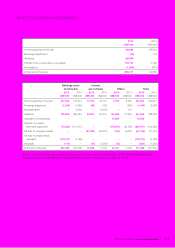
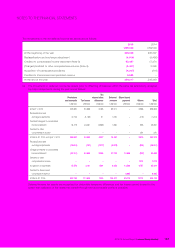
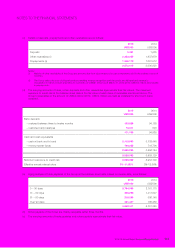
24 BANK DEPOSITS AND CASH AND CASH EQUIVALENTS
2015 2014
US$’000 US$’000
Bank deposits
– matured between three to twelve months 100,828 94,165
– restricted bank balances 70,311 820
171,139 94,985
Cash and cash equivalents
– cash at bank and in hand 2,110,990 3,138,440
– money market funds 744,233 719,704
2,855,223 3,858,144
3,026,362 3,953,129
Maximum exposure to credit risk 3,026,362 3,953,129
Effective annual interest rates 0%-11.60% 0%-12.36%
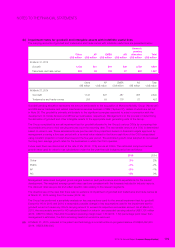
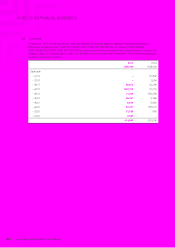
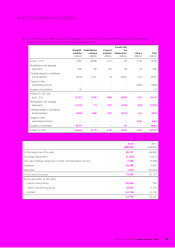
25 PAYABLES
(a) Aging analysis of trade payables of the Group at the balance sheet date, based on invoice date, is as follows:
2015 2014
US$’000 US$’000
0 – 30 days 3,764,369 2,761,170
31 – 60 days 358,296 1,217,547
61 – 90 days 218,299 586,145
Over 90 days 321,447 186,483
4,662,411 4,751,345
(b) Notes payable of the Group are mainly repayable within three months.
(c) The carrying amounts of trade payables and notes payable approximate their fair value.