Lenovo 2015 Annual Report Download - page 183
Download and view the complete annual report
Please find page 183 of the 2015 Lenovo annual report below. You can navigate through the pages in the report by either clicking on the pages listed below, or by using the keyword search tool below to find specific information within the annual report.-
 1
1 -
2
-
3
-
4
-
5
-
6
-
7
-
8
-
9
-
10
-
11
-
12
-
13
-
14
-
15
-
16
-
17
-
18
-
19
-
20
-
21
-
22
-
23
-
24
-
25
-
26
-
27
-
28
-
29
-
30
-
31
-
32
-
33
-
34
-
35
-
36
-
37
-
38
-
39
-
40
-
41
-
42
-
43
-
44
-
45
-
46
-
47
-
48
-
49
-
50
-
51
-
52
-
53
-
54
-
55
-
56
-
57
-
58
-
59
-
60
-
61
-
62
-
63
-
64
-
65
-
66
-
67
-
68
-
69
-
70
-
71
-
72
-
73
-
74
-
75
-
76
-
77
-
78
-
79
-
80
-
81
-
82
-
83
-
84
-
85
-
86
-
87
-
88
-
89
-
90
-
91
-
92
-
93
-
94
-
95
-
96
-
97
-
98
-
99
-
100
-
101
-
102
-
103
-
104
-
105
-
106
-
107
-
108
-
109
-
110
-
111
-
112
-
113
-
114
-
115
-
116
-
117
-
118
-
119
-
120
-
121
-
122
-
123
-
124
-
125
-
126
-
127
-
128
-
129
-
130
-
131
-
132
-
133
-
134
-
135
-
136
-
137
-
138
-
139
-
140
-
141
-
142
-
143
-
144
-
145
-
146
-
147
-
148
-
149
-
150
-
151
-
152
-
153
-
154
-
155
-
156
-
157
-
158
-
159
-
160
-
161
-
162
-
163
-
164
-
165
-
166
-
167
-
168
-
169
-
170
-
171
-
172
-
 173
173 -
 174
174 -
 175
175 -
 176
176 -
 177
177 -
 178
178 -
 179
179 -
 180
180 -
 181
181 -
 182
182 -
 183
183 -
 184
184 -
 185
185 -
 186
186 -
 187
187 -
 188
188 -
 189
189 -
 190
190 -
 191
191 -
 192
192 -
 193
193 -
194
-
195
-
196
-
197
-
198
-
199
-
200
-
201
-
202
-
203
-
204
-
205
-
206
-
207
-
208
-
209
-
210
-
211
-
212
-
213
-
214
-
215
 |
 |

181
2014/15 Annual Report Lenovo Group Limited
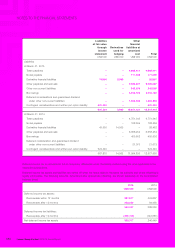
NOTES TO THE FINANCIAL STATEMENTS
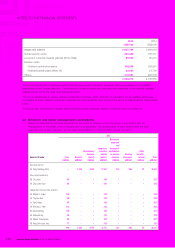
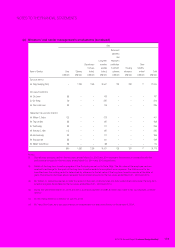
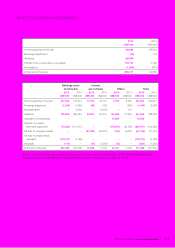
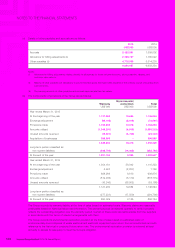
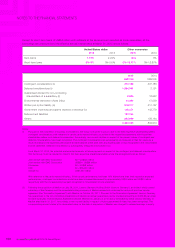
19 FINANCIAL INSTRUMENTS BY CATEGORY
Loans and
receivables
Assets at
fair value
through
income
statement
Derivatives
used for
hedging
Available-
for-sale
financial
assets Total
US$’000 US$’000 US$’000 US$’000 US$’000
Assets
At March 31, 2015
Available-for-sale financial assets – – – 73,400 73,400
Derivative financial assets –60,459 124,075 –184,534
Trade receivables 5,177,840 – – – 5,177,840
Notes receivable 334,738 –––334,738
Deposits and other receivables 2,325,836 – – – 2,325,836
Bank deposits 171,139 –––171,139
Cash and cash equivalents 2,855,223 –––2,855,223
10,864,776 60,459 124,075 73,400 11,122,710
At March 31, 2014
Available-for-sale financial assets –––35,157 35,157
Derivative financial assets –49,460 11,724 –61,184
Trade receivables 3,171,354 –––3,171,354
Notes receivable 447,325 – – – 447,325
Deposits and other receivables 1,939,314 –––1,939,314
Bank deposits 94,985 –––94,985
Cash and cash equivalents 3,858,144 – – – 3,858,144
9,511,122 49,460 11,724 35,157 9,607,463