Lenovo 2015 Annual Report Download - page 171
Download and view the complete annual report
Please find page 171 of the 2015 Lenovo annual report below. You can navigate through the pages in the report by either clicking on the pages listed below, or by using the keyword search tool below to find specific information within the annual report.-
 1
1 -
2
-
3
-
4
-
5
-
6
-
7
-
8
-
9
-
10
-
11
-
12
-
13
-
14
-
15
-
16
-
17
-
18
-
19
-
20
-
21
-
22
-
23
-
24
-
25
-
26
-
27
-
28
-
29
-
30
-
31
-
32
-
33
-
34
-
35
-
36
-
37
-
38
-
39
-
40
-
41
-
42
-
43
-
44
-
45
-
46
-
47
-
48
-
49
-
50
-
51
-
52
-
53
-
54
-
55
-
56
-
57
-
58
-
59
-
60
-
61
-
62
-
63
-
64
-
65
-
66
-
67
-
68
-
69
-
70
-
71
-
72
-
73
-
74
-
75
-
76
-
77
-
78
-
79
-
80
-
81
-
82
-
83
-
84
-
85
-
86
-
87
-
88
-
89
-
90
-
91
-
92
-
93
-
94
-
95
-
96
-
97
-
98
-
99
-
100
-
101
-
102
-
103
-
104
-
105
-
106
-
107
-
108
-
109
-
110
-
111
-
112
-
113
-
114
-
115
-
116
-
117
-
118
-
119
-
120
-
121
-
122
-
123
-
124
-
125
-
126
-
127
-
128
-
129
-
130
-
131
-
132
-
133
-
134
-
135
-
136
-
137
-
138
-
139
-
140
-
141
-
142
-
143
-
144
-
145
-
146
-
147
-
148
-
149
-
150
-
151
-
152
-
153
-
154
-
155
-
156
-
157
-
158
-
159
-
160
-
 161
161 -
 162
162 -
 163
163 -
 164
164 -
 165
165 -
 166
166 -
 167
167 -
 168
168 -
 169
169 -
 170
170 -
 171
171 -
 172
172 -
 173
173 -
 174
174 -
 175
175 -
 176
176 -
 177
177 -
 178
178 -
 179
179 -
 180
180 -
 181
181 -
182
-
183
-
184
-
185
-
186
-
187
-
188
-
189
-
190
-
191
-
192
-
193
-
194
-
195
-
196
-
197
-
198
-
199
-
200
-
201
-
202
-
203
-
204
-
205
-
206
-
207
-
208
-
209
-
210
-
211
-
212
-
213
-
214
-
215
 |
 |

169
2014/15 Annual Report Lenovo Group Limited
NOTES TO THE FINANCIAL STATEMENTS
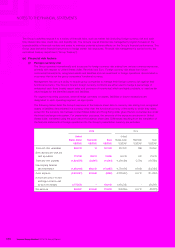
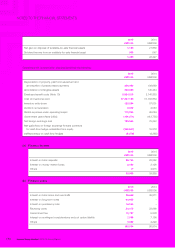
5 SEGMENT INFORMATION (continued)
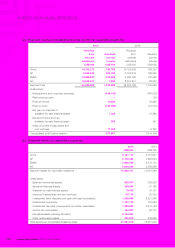
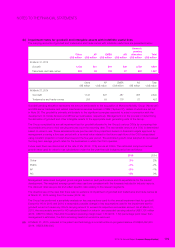
(c) Segment liabilities for reportable segments
2015 2014
US$’000 US$’000
China 4,250,546 3,965,295
AP 1,697,066 1,671,669
EMEA 1,589,515 1,407,530
AG 5,005,649 1,636,349
Segment liabilities for reportable segments 12,542,776 8,680,843
Unallocated:
Income tax payable 168,536 177,741
Deferred income tax liabilities 200,730 142,881
Derivative financial liabilities 80,897 58,462
Unallocated borrowings 2,924,352 300,000
Unallocated trade payables 2,631,917 2,862,851
Unallocated other payables and accruals 2,499,007 2,687,703
Unallocated provisions 11,655 16,522
Unallocated other non-current liabilities 1,806,831 308,889
Other unallocated liabilities 108,456 96,481
Total liabilities per consolidated balance sheet 22,975,157 15,332,373
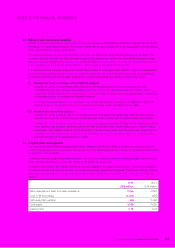
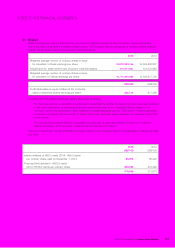
(d) Analysis of revenue by significant category
Revenue from external customers are mainly derived from the sale of personal technology products and services.
Breakdown of revenue by business group is as follows:
2015 2014
US$’000 US$’000
PC Business Group 33,346,120 31,632,868
Mobile Business Group 9,142,211 5,353,635
Enterprise Business Group 2,627,408 505,307
Others 1,179,854 1,215,319
46,295,593 38,707,129
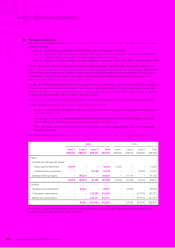
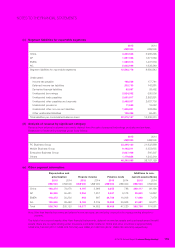
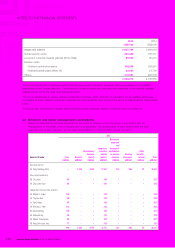
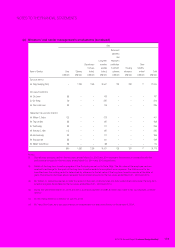
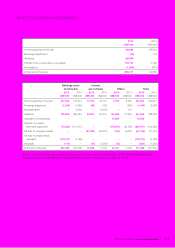
(e) Other segment information
Depreciation and
amortization Finance income Finance costs
Additions to non-
current assets (Note)
2015 2014 2015 2014 2015 2014 2015 2014
US$’000 US$’000 US$’000 US$’000 US$’000 US$’000 US$’000 US$’000
China 148,274 79,970 4,197 3,966 2,255 788 249,117 99,190
AP 86,248 55,481 3,254 1,251 9,457 6,318 35,840 14,822
EMEA 118,273 50,234 463 697 24,788 10,206 17,098 7,978
AG 155,948 69,448 8,163 8,739 19,908 29,908 61,681 52,071
Total 508,743 255,133 16,077 14,653 56,408 47,220 363,736 174,061
Note: Other than financial instruments and deferred income tax assets; and excluding construction-in-progress pending allocation to
segments.
The total of non-current assets other than financial instruments, deferred income tax assets and post-employment benefit
assets (there are no rights arising under insurance contracts) located in China and other countries is approximately
US$2,639,744,000 (2014: US$2,305,752,000) and US$8,410,352,000 (2014: US$2,226,306,000) respectively.