Lenovo 2015 Annual Report Download - page 41
Download and view the complete annual report
Please find page 41 of the 2015 Lenovo annual report below. You can navigate through the pages in the report by either clicking on the pages listed below, or by using the keyword search tool below to find specific information within the annual report.-
 1
1 -
2
-
3
-
4
-
5
-
6
-
7
-
8
-
9
-
10
-
11
-
12
-
13
-
14
-
15
-
16
-
17
-
18
-
19
-
20
-
21
-
22
-
23
-
24
-
25
-
26
-
27
-
28
-
29
-
30
-
 31
31 -
 32
32 -
 33
33 -
 34
34 -
 35
35 -
 36
36 -
 37
37 -
 38
38 -
 39
39 -
 40
40 -
 41
41 -
 42
42 -
 43
43 -
 44
44 -
 45
45 -
 46
46 -
 47
47 -
 48
48 -
 49
49 -
 50
50 -
 51
51 -
52
-
53
-
54
-
55
-
56
-
57
-
58
-
59
-
60
-
61
-
62
-
63
-
64
-
65
-
66
-
67
-
68
-
69
-
70
-
71
-
72
-
73
-
74
-
75
-
76
-
77
-
78
-
79
-
80
-
81
-
82
-
83
-
84
-
85
-
86
-
87
-
88
-
89
-
90
-
91
-
92
-
93
-
94
-
95
-
96
-
97
-
98
-
99
-
100
-
101
-
102
-
103
-
104
-
105
-
106
-
107
-
108
-
109
-
110
-
111
-
112
-
113
-
114
-
115
-
116
-
117
-
118
-
119
-
120
-
121
-
122
-
123
-
124
-
125
-
126
-
127
-
128
-
129
-
130
-
131
-
132
-
133
-
134
-
135
-
136
-
137
-
138
-
139
-
140
-
141
-
142
-
143
-
144
-
145
-
146
-
147
-
148
-
149
-
150
-
151
-
152
-
153
-
154
-
155
-
156
-
157
-
158
-
159
-
160
-
161
-
162
-
163
-
164
-
165
-
166
-
167
-
168
-
169
-
170
-
171
-
172
-
173
-
174
-
175
-
176
-
177
-
178
-
179
-
180
-
181
-
182
-
183
-
184
-
185
-
186
-
187
-
188
-
189
-
190
-
191
-
192
-
193
-
194
-
195
-
196
-
197
-
198
-
199
-
200
-
201
-
202
-
203
-
204
-
205
-
206
-
207
-
208
-
209
-
210
-
211
-
212
-
213
-
214
-
215
 |
 |

39
2014/15 Annual Report Lenovo Group Limited
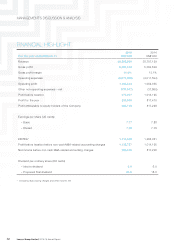
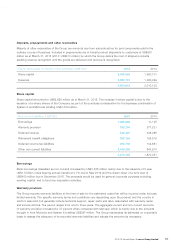
Borrowings
Borrowings (classified as current) amounted to US$1,168 million as at March 31, 2015, representing an increase of
162 percent over last year, which is mainly attributable to the drawdown of loans of US$1,431 million offset by loan
repayment of US$678 million during the year.
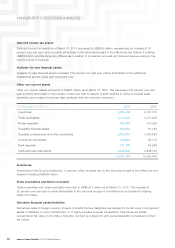
CAPITAL EXPENDITURE
The Group incurred capital expenditure of US$972 million (2014: US$675 million) during the year ended March 31,
2015, mainly for the acquisition of property, plant and equipment, prepaid lease payments, additions in construction-
in-progress and intangible assets.
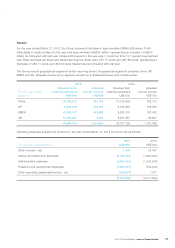
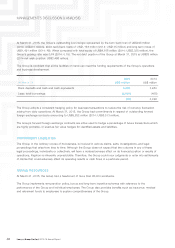
LIQUIDITY AND FINANCIAL RESOURCES
At March 31, 2015, total assets of the Group amounted to US$27,081 million (2014: US$18,357 million), which
were financed by equity attributable to owners of the Company of US$4,084 million (2014: US$3,010 million), non-
controlling interests (net of put option written on non-controlling interest) of US$22 million (2014: US$15 million), and
total liabilities of US$22,975 million (2014: US$15,332 million). At March 31, 2015, the current ratio of the Group
was 0.90 (2014: 1.00).
The Group had a solid financial position. At March 31, 2015, bank deposits, cash and cash equivalents totaled
US$3,026 million (2014: US$3,953 million), of which 53.2 (2014: 66.9) percent was denominated in US dollar, 35.6
(2014: 23.8) percent in Renminbi, 2.8 (2014: 4.1) percent in Euro, 0.7 (2014: 2.2) percent in Japanese Yen, and 7.7
(2014: 3.0) percent in other currencies.
The Group adopts a conservative policy to invest the surplus cash generated from operations. At March 31, 2015,
75.4 (2014: 81.8) percent of cash are bank deposits, and 24.6 (2014: 18.2) percent of cash are investments in liquid
money market funds of investment grade.
Although the Group has consistently maintained a very liquid position, banking facilities have nevertheless been put
in place for contingency purposes.
The Group entered into 5-Year revolving loan facility agreement with syndicated banks for US$500 million on
February 2, 2011. The facility was utilized to the extent of US$300 million as at March 31, 2015 (2014: Nil).
In addition, on December 18, 2013, the Group entered into another 5-Year loan facility agreement with syndicated
banks for US$1,200 million, comprising US$800 million as short term. The facility was utilized to the extent of
US$1,100 million, comprising US$700 million short-term, as at March 31, 2015 (2014: Nil).
On May 8, 2014, the Group completed the issuance of 5-Year US$1.5 billion notes bearing annual interest at 4.7%
due in May 2019. The proceeds would be used for general corporate purposes including working capital, and to
fund any acquisition activities.
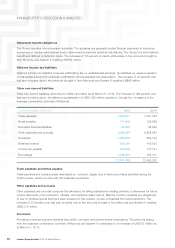
The Group has also arranged other short-term credit facilities. At March 31, 2015, the Group’s total available credit
facilities amounted to US$12,223 million (2014: US$7,890 million), of which US$1,353 million (2014: US$489 million)
was in trade lines, US$339 million (2014: US$325 million) in short-term and revolving money market facilities and
US$10,531 million (2014: US$7,076 million) in forward foreign exchange contracts. At March 31, 2015, the amounts
drawn down were US$316 million (2014: US$214 million) in trade lines, US$9,822 million (2014: US$6,513 million)
being used for the forward foreign exchange contracts, and US$177 million (2014: US$145 million) in short-term
bank loans.