Lenovo 2015 Annual Report Download - page 22
Download and view the complete annual report
Please find page 22 of the 2015 Lenovo annual report below. You can navigate through the pages in the report by either clicking on the pages listed below, or by using the keyword search tool below to find specific information within the annual report.-
 1
1 -
2
-
3
-
4
-
5
-
6
-
7
-
8
-
9
-
10
-
11
-
 12
12 -
 13
13 -
 14
14 -
 15
15 -
 16
16 -
 17
17 -
 18
18 -
 19
19 -
 20
20 -
 21
21 -
 22
22 -
 23
23 -
 24
24 -
 25
25 -
 26
26 -
 27
27 -
 28
28 -
 29
29 -
 30
30 -
 31
31 -
 32
32 -
33
-
34
-
35
-
36
-
37
-
38
-
39
-
40
-
41
-
42
-
43
-
44
-
45
-
46
-
47
-
48
-
49
-
50
-
51
-
52
-
53
-
54
-
55
-
56
-
57
-
58
-
59
-
60
-
61
-
62
-
63
-
64
-
65
-
66
-
67
-
68
-
69
-
70
-
71
-
72
-
73
-
74
-
75
-
76
-
77
-
78
-
79
-
80
-
81
-
82
-
83
-
84
-
85
-
86
-
87
-
88
-
89
-
90
-
91
-
92
-
93
-
94
-
95
-
96
-
97
-
98
-
99
-
100
-
101
-
102
-
103
-
104
-
105
-
106
-
107
-
108
-
109
-
110
-
111
-
112
-
113
-
114
-
115
-
116
-
117
-
118
-
119
-
120
-
121
-
122
-
123
-
124
-
125
-
126
-
127
-
128
-
129
-
130
-
131
-
132
-
133
-
134
-
135
-
136
-
137
-
138
-
139
-
140
-
141
-
142
-
143
-
144
-
145
-
146
-
147
-
148
-
149
-
150
-
151
-
152
-
153
-
154
-
155
-
156
-
157
-
158
-
159
-
160
-
161
-
162
-
163
-
164
-
165
-
166
-
167
-
168
-
169
-
170
-
171
-
172
-
173
-
174
-
175
-
176
-
177
-
178
-
179
-
180
-
181
-
182
-
183
-
184
-
185
-
186
-
187
-
188
-
189
-
190
-
191
-
192
-
193
-
194
-
195
-
196
-
197
-
198
-
199
-
200
-
201
-
202
-
203
-
204
-
205
-
206
-
207
-
208
-
209
-
210
-
211
-
212
-
213
-
214
-
215
 |
 |

20 Lenovo Group Limited 2014/15 Annual Report
MANAGEMENT’S DISCUSSION & ANALYSIS
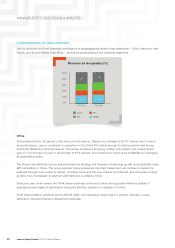
PERFORMANCE OF GEOGRAPHIES
Lenovo achieved solid and balanced performance in all geographies where it has operations – China, Americas, Asia
Pacific, and Europe-Middle East-Africa – as well as across product and customer segments.
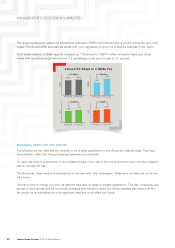
Revenue by Geography (%)
AG
APChina
EMEA
FY13/14
100%
80%
60%
40%
20%
0%
FY14/15
32%
26%
14%
28%
38%
21%
16%
25%
China
China accounted for 32 percent of the Group’s total revenue. Despite the softness of the PC market due to macro-
economic issues, Lenovo continued to outperform in the China PC market through its solid execution and strong
brand and distribution channel network. The Group maintained its strong number one position with market share
gain of 1.5 point year-on-year to record-high of 36.6 percent, and continued to improve its profitability by leveraging
its leadership position.
The Group has refined its Lenovo brand smartphone strategy and focused on balancing growth and profitability amid
stiff competition in China. The Group believes China remains an important market and will continue to expand its
business through more routes to market, including online and the new channel from ShenQi, and a broader product
portfolio from mainstream to premium with Motorola re-entering China.
During the year under review, the Think Server business continued to show strong growth while the System X
business showed signs of stabilization during the first two quarters of integration in China.
Profit before taxation remained flat at US$795 million and operating margin was 5.4 percent, flat year-on-year
attribute to the performance in smartphone business.