Lenovo 2015 Annual Report Download - page 203
Download and view the complete annual report
Please find page 203 of the 2015 Lenovo annual report below. You can navigate through the pages in the report by either clicking on the pages listed below, or by using the keyword search tool below to find specific information within the annual report.-
 1
1 -
2
-
3
-
4
-
5
-
6
-
7
-
8
-
9
-
10
-
11
-
12
-
13
-
14
-
15
-
16
-
17
-
18
-
19
-
20
-
21
-
22
-
23
-
24
-
25
-
26
-
27
-
28
-
29
-
30
-
31
-
32
-
33
-
34
-
35
-
36
-
37
-
38
-
39
-
40
-
41
-
42
-
43
-
44
-
45
-
46
-
47
-
48
-
49
-
50
-
51
-
52
-
53
-
54
-
55
-
56
-
57
-
58
-
59
-
60
-
61
-
62
-
63
-
64
-
65
-
66
-
67
-
68
-
69
-
70
-
71
-
72
-
73
-
74
-
75
-
76
-
77
-
78
-
79
-
80
-
81
-
82
-
83
-
84
-
85
-
86
-
87
-
88
-
89
-
90
-
91
-
92
-
93
-
94
-
95
-
96
-
97
-
98
-
99
-
100
-
101
-
102
-
103
-
104
-
105
-
106
-
107
-
108
-
109
-
110
-
111
-
112
-
113
-
114
-
115
-
116
-
117
-
118
-
119
-
120
-
121
-
122
-
123
-
124
-
125
-
126
-
127
-
128
-
129
-
130
-
131
-
132
-
133
-
134
-
135
-
136
-
137
-
138
-
139
-
140
-
141
-
142
-
143
-
144
-
145
-
146
-
147
-
148
-
149
-
150
-
151
-
152
-
153
-
154
-
155
-
156
-
157
-
158
-
159
-
160
-
161
-
162
-
163
-
164
-
165
-
166
-
167
-
168
-
169
-
170
-
171
-
172
-
173
-
174
-
175
-
176
-
177
-
178
-
179
-
180
-
181
-
182
-
183
-
184
-
185
-
186
-
187
-
188
-
189
-
190
-
191
-
192
-
 193
193 -
 194
194 -
 195
195 -
 196
196 -
 197
197 -
 198
198 -
 199
199 -
 200
200 -
 201
201 -
 202
202 -
 203
203 -
 204
204 -
 205
205 -
 206
206 -
 207
207 -
 208
208 -
 209
209 -
 210
210 -
 211
211 -
 212
212 -
 213
213 -
214
-
215
 |
 |

201
2014/15 Annual Report Lenovo Group Limited
NOTES TO THE FINANCIAL STATEMENTS
35 RETIREMENT BENEFIT OBLIGATIONS (continued)
(b) Post-employment medical benefits (continued)
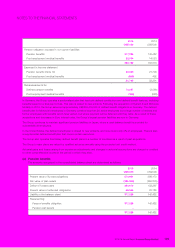
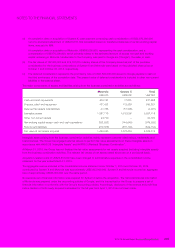
The amounts recognized in the consolidated balance sheet are determined as follows:
2015 2014
US$’000 US$’000
Present value of funded obligations 26,545 18,287
Fair value of plan assets (5,333) (5,545)
21,212 12,742
Present value of unfunded obligations 1,342 1,291
Liability in the balance sheet 22,554 14,033
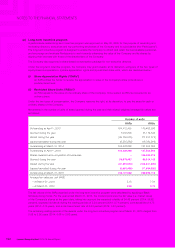
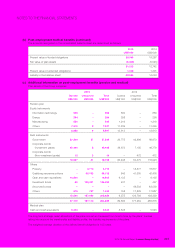
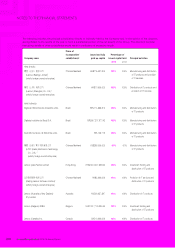
(c) Additional information on post-employment benefits (pension and medical)
Plan assets of the Group comprise:
2015 2014
Quoted Unquoted Total Quoted Unquoted Total
US$’000 US$’000 US$’000 US$’000 US$’000 US$’000
Pension plan
Equity instruments
Information technology 556 –556 860 –860
Energy 284 –284 298 –298
Manufacturing 530 –530 1,216 –1,216
Others 7,518 97,527 11,239 –11,239
8,888 98,897 13,613 –13,613
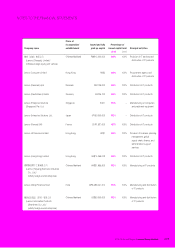
Debt instruments
Government 27,209 37 27,246 26,775 42,898 69,673
Corporate bonds
(investment grade) 45,446 245,448 39,673 7,105 46,778
Corporate bonds
(Non-investment grade) 12 214 –472 472
72,667 41 72,708 66,448 50,475 116,923
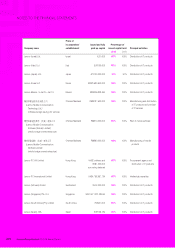
Others
Property –3,770 3,770 –18,877 18,877
Qualifying insurance policies –56,132 56,132 845 41,555 42,400
Cash and cash equivalents 14,800 –14,800 8,135 –8,135
Investment funds 89 126,401 126,490 437 –437
Structured bonds – – – –48,503 48,503
Others 675 757 1,432 158 17,829 17,987
15,564 187,060 202,624 9,575 126,764 136,339
97,119 187,110 284,229 89,636 177,239 266,875
Medical plan
Cash and cash equivalents 5,333 –5,333 5,545 –5,545
The long term strategic asset allocations of the plans are set and reviewed from time to time by the plans’ trustees
taking into account the membership and liability profile, the liquidity requirements of the plans.
The weighted average duration of the defined benefit obligation is 14.5 years.