Lenovo 2015 Annual Report Download - page 142
Download and view the complete annual report
Please find page 142 of the 2015 Lenovo annual report below. You can navigate through the pages in the report by either clicking on the pages listed below, or by using the keyword search tool below to find specific information within the annual report.-
 1
1 -
2
-
3
-
4
-
5
-
6
-
7
-
8
-
9
-
10
-
11
-
12
-
13
-
14
-
15
-
16
-
17
-
18
-
19
-
20
-
21
-
22
-
23
-
24
-
25
-
26
-
27
-
28
-
29
-
30
-
31
-
32
-
33
-
34
-
35
-
36
-
37
-
38
-
39
-
40
-
41
-
42
-
43
-
44
-
45
-
46
-
47
-
48
-
49
-
50
-
51
-
52
-
53
-
54
-
55
-
56
-
57
-
58
-
59
-
60
-
61
-
62
-
63
-
64
-
65
-
66
-
67
-
68
-
69
-
70
-
71
-
72
-
73
-
74
-
75
-
76
-
77
-
78
-
79
-
80
-
81
-
82
-
83
-
84
-
85
-
86
-
87
-
88
-
89
-
90
-
91
-
92
-
93
-
94
-
95
-
96
-
97
-
98
-
99
-
100
-
101
-
102
-
103
-
104
-
105
-
106
-
107
-
108
-
109
-
110
-
111
-
112
-
113
-
114
-
115
-
116
-
117
-
118
-
119
-
120
-
121
-
122
-
123
-
124
-
125
-
126
-
127
-
128
-
129
-
130
-
131
-
 132
132 -
 133
133 -
 134
134 -
 135
135 -
 136
136 -
 137
137 -
 138
138 -
 139
139 -
 140
140 -
 141
141 -
 142
142 -
 143
143 -
 144
144 -
 145
145 -
 146
146 -
 147
147 -
 148
148 -
 149
149 -
 150
150 -
 151
151 -
 152
152 -
153
-
154
-
155
-
156
-
157
-
158
-
159
-
160
-
161
-
162
-
163
-
164
-
165
-
166
-
167
-
168
-
169
-
170
-
171
-
172
-
173
-
174
-
175
-
176
-
177
-
178
-
179
-
180
-
181
-
182
-
183
-
184
-
185
-
186
-
187
-
188
-
189
-
190
-
191
-
192
-
193
-
194
-
195
-
196
-
197
-
198
-
199
-
200
-
201
-
202
-
203
-
204
-
205
-
206
-
207
-
208
-
209
-
210
-
211
-
212
-
213
-
214
-
215
 |
 |

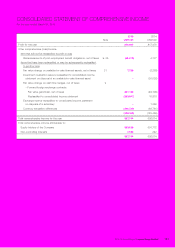
140 Lenovo Group Limited 2014/15 Annual Report
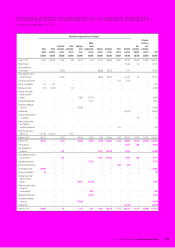
CONSOLIDATED INCOME STATEMENT
For the year ended March 31, 2015
Note
2015
US$’000
2014
US$’000
Revenue 546,295,593 38,707,129
Cost of sales (39,613,780) (33,643,480)
Gross profit 6,681,813 5,063,649
Other income – net 61,490 22,427
Selling and distribution expenses (2,302,182) (1,900,005)
Administrative expenses (1,883,114) (1,402,979)
Research and development expenses (1,220,919) (732,454)
Other operating (expenses)/income – net (168,574) 1,417
Operating profit 71,108,514 1,052,055
Finance income 8(a) 30,902 33,893
Finance costs 8(b) (185,504) (80,974)
Share of profits of associates and joint ventures 18 17,055 9,221
Profit before taxation 970,967 1,014,195
Taxation 9(134,364) (196,725)
Profit for the year 836,603 817,470
Profit attributable to:
Equity holders of the Company 828,715 817,228
Non-controlling interests 7,888 242
836,603 817,470
Earnings per share attributable to equity holders of the Company
Basic 12(a) US7.77 cents US7.88 cents
Diluted 12(b) US7.69 cents US7.78 cents
Dividends 13 379,646 321,875