Lenovo 2015 Annual Report Download - page 187
Download and view the complete annual report
Please find page 187 of the 2015 Lenovo annual report below. You can navigate through the pages in the report by either clicking on the pages listed below, or by using the keyword search tool below to find specific information within the annual report.-
 1
1 -
2
-
3
-
4
-
5
-
6
-
7
-
8
-
9
-
10
-
11
-
12
-
13
-
14
-
15
-
16
-
17
-
18
-
19
-
20
-
21
-
22
-
23
-
24
-
25
-
26
-
27
-
28
-
29
-
30
-
31
-
32
-
33
-
34
-
35
-
36
-
37
-
38
-
39
-
40
-
41
-
42
-
43
-
44
-
45
-
46
-
47
-
48
-
49
-
50
-
51
-
52
-
53
-
54
-
55
-
56
-
57
-
58
-
59
-
60
-
61
-
62
-
63
-
64
-
65
-
66
-
67
-
68
-
69
-
70
-
71
-
72
-
73
-
74
-
75
-
76
-
77
-
78
-
79
-
80
-
81
-
82
-
83
-
84
-
85
-
86
-
87
-
88
-
89
-
90
-
91
-
92
-
93
-
94
-
95
-
96
-
97
-
98
-
99
-
100
-
101
-
102
-
103
-
104
-
105
-
106
-
107
-
108
-
109
-
110
-
111
-
112
-
113
-
114
-
115
-
116
-
117
-
118
-
119
-
120
-
121
-
122
-
123
-
124
-
125
-
126
-
127
-
128
-
129
-
130
-
131
-
132
-
133
-
134
-
135
-
136
-
137
-
138
-
139
-
140
-
141
-
142
-
143
-
144
-
145
-
146
-
147
-
148
-
149
-
150
-
151
-
152
-
153
-
154
-
155
-
156
-
157
-
158
-
159
-
160
-
161
-
162
-
163
-
164
-
165
-
166
-
167
-
168
-
169
-
170
-
171
-
172
-
173
-
174
-
175
-
176
-
 177
177 -
 178
178 -
 179
179 -
 180
180 -
 181
181 -
 182
182 -
 183
183 -
 184
184 -
 185
185 -
 186
186 -
 187
187 -
 188
188 -
 189
189 -
 190
190 -
 191
191 -
 192
192 -
 193
193 -
 194
194 -
 195
195 -
 196
196 -
 197
197 -
198
-
199
-
200
-
201
-
202
-
203
-
204
-
205
-
206
-
207
-
208
-
209
-
210
-
211
-
212
-
213
-
214
-
215
 |
 |

185
2014/15 Annual Report Lenovo Group Limited
NOTES TO THE FINANCIAL STATEMENTS
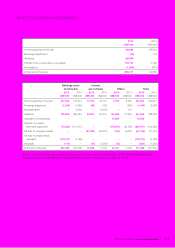
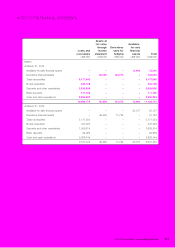
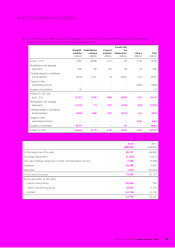
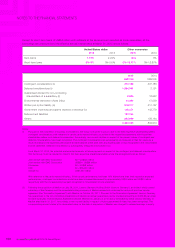
20 DEFERRED INCOME TAX ASSETS AND LIABILITIES (continued)
(b) The movements in deferred income tax liabilities (prior to offsetting of balances within the same tax jurisdiction),
analyzed by major components, during the year are as follows:
Intangible
valuation
Undistributed
earnings
Property
valuation
Accelerated
tax
depreciation Others Total
US$’000 US$’000 US$’000 US$’000 US$’000 US$’000
At April 1, 2013 72,093 36,586 4,273 748 4,729 118,429
Reclassification and exchange
adjustments 1,463 485 333 (18) 33 2,296
(Credited)/charged to consolidated
income statement (5,845) 10,427 (12) 23,864 (247) 28,187
Credited to other
comprehensive income ––––(2,999) (2,999)
Acquisition of subsidiaries 216 – – – – 216
At March 31, 2014 and
April 1, 2014 67,927 47,498 4,594 24,594 1,516 146,129
Reclassification and exchange
adjustments (17,912) 774 (821) (3,285) (223) (21,467)
(Credited)/charged to consolidated
income statement (6,358) 3,498 (631) (2,124) 814 (4,801)
Charged to other
comprehensive income – – – – 4,463 4,463
Acquisition of businesses 85,973 – – 118 –86,091
At March 31, 2015 129,630 51,770 3,142 19,303 6,570 210,415
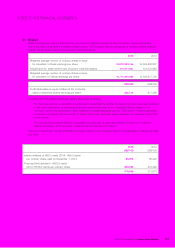
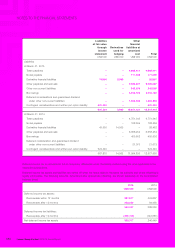
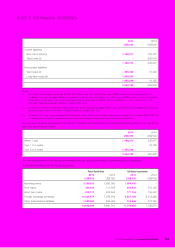
21 AVAILABLE-FOR-SALE FINANCIAL ASSETS
2015 2014
US$’000 US$’000
At the beginning of the year 35,157 69,962
Exchange adjustment (1,442) (1,073)
Fair value change recognized in other comprehensive income 7,326 (2,288)
Additions 32,596 8,550
Disposals (237) (39,994)
At the end of the year 73,400 35,157
Equity securities, at fair value
Listed in Hong Kong 20,692 722
Listed outside Hong Kong 18,600 9,733
Unlisted 34,108 24,702
73,400 35,157