Lenovo 2015 Annual Report Download - page 19
Download and view the complete annual report
Please find page 19 of the 2015 Lenovo annual report below. You can navigate through the pages in the report by either clicking on the pages listed below, or by using the keyword search tool below to find specific information within the annual report.-
 1
1 -
2
-
3
-
4
-
5
-
6
-
7
-
8
-
 9
9 -
 10
10 -
 11
11 -
 12
12 -
 13
13 -
 14
14 -
 15
15 -
 16
16 -
 17
17 -
 18
18 -
 19
19 -
 20
20 -
 21
21 -
 22
22 -
 23
23 -
 24
24 -
 25
25 -
 26
26 -
 27
27 -
 28
28 -
 29
29 -
30
-
31
-
32
-
33
-
34
-
35
-
36
-
37
-
38
-
39
-
40
-
41
-
42
-
43
-
44
-
45
-
46
-
47
-
48
-
49
-
50
-
51
-
52
-
53
-
54
-
55
-
56
-
57
-
58
-
59
-
60
-
61
-
62
-
63
-
64
-
65
-
66
-
67
-
68
-
69
-
70
-
71
-
72
-
73
-
74
-
75
-
76
-
77
-
78
-
79
-
80
-
81
-
82
-
83
-
84
-
85
-
86
-
87
-
88
-
89
-
90
-
91
-
92
-
93
-
94
-
95
-
96
-
97
-
98
-
99
-
100
-
101
-
102
-
103
-
104
-
105
-
106
-
107
-
108
-
109
-
110
-
111
-
112
-
113
-
114
-
115
-
116
-
117
-
118
-
119
-
120
-
121
-
122
-
123
-
124
-
125
-
126
-
127
-
128
-
129
-
130
-
131
-
132
-
133
-
134
-
135
-
136
-
137
-
138
-
139
-
140
-
141
-
142
-
143
-
144
-
145
-
146
-
147
-
148
-
149
-
150
-
151
-
152
-
153
-
154
-
155
-
156
-
157
-
158
-
159
-
160
-
161
-
162
-
163
-
164
-
165
-
166
-
167
-
168
-
169
-
170
-
171
-
172
-
173
-
174
-
175
-
176
-
177
-
178
-
179
-
180
-
181
-
182
-
183
-
184
-
185
-
186
-
187
-
188
-
189
-
190
-
191
-
192
-
193
-
194
-
195
-
196
-
197
-
198
-
199
-
200
-
201
-
202
-
203
-
204
-
205
-
206
-
207
-
208
-
209
-
210
-
211
-
212
-
213
-
214
-
215
 |
 |

17
2014/15 Annual Report Lenovo Group Limited
BUSINESS REVIEW
Fiscal year 2014/15 was another record year for Lenovo with a more diversified business. Lenovo continued to
deliver solid performance along with smooth integration of Motorola and System X. The Group has broadened
its device business from PC to include mobile and enterprise businesses. All these businesses delivered strong
performance and contributed to the Group’s record performance during the year under review. The Group’s PC
business continued to lead the industry, while the M&A transactions further strengthened its mobile and enterprise
business as two new growth pillars for the Group. During the year under review, Lenovo continued to strengthen
its leading position in the PC industry with record shipments and continuous growth in revenue, share and profit.
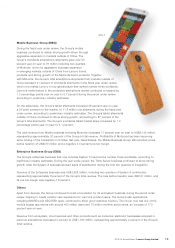
The Group’s mobile business together with Motorola delivered record shipments and built a more globally balanced
business. The Group’s Think Server business recorded hyper-growth while the System X business integration has
been on track and stabilized towards the fiscal year-end. The Group has included two quarters of System X and five
months’ of Motorola performance in the Group’s fiscal year results.
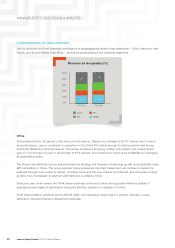
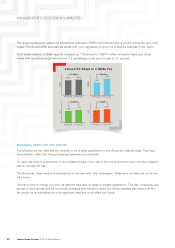
For the fiscal year ended March 31, 2015, the Group’s consolidated revenue increased by 20 percent year-on-year
to record-high US$46,296 million. Excluding currency impacts, the revenue increase would be 23 percent compared
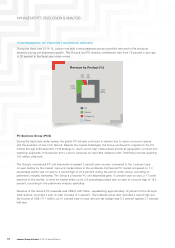
to last fiscal year. Revenue of the Group’s PC business was US$33,346 million, representing a year-on-year increase
of 5 percent. The revenue of Mobile business increased 71 percent year-on-year to US$9,142 million. The revenue
of Enterprise business increased 420 percent year-on-year to US$2,628 million. Meanwhile, revenue of other goods
and services were US$1,180 million.
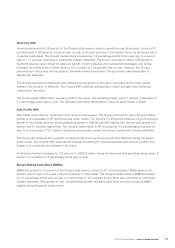
The Group’s gross profit increased by 32 percent year-
on-year to US$6,682 million and gross margin increased
1.3 percentage points year-on-year to 14.4 percent.
Operating expenses increased by 39 percent year-on-
year to US$5,574 million. The expenses-to-revenue ratio
was 12.0 percent. Both gross margin and expense to
revenue ratio have included the increase from adding
System X and Motorola businesses. The Group’s profit
before taxation before non-cash M&A related accounting
charges was US$1,139 million, up 12 percent against
last year. The non-cash M&A-related charges included
intangible asset amortization, imputed interest expense
of the three-year promissory note issued as part of
the transaction, and others. The Group’s profit before
taxation reached US$971 million, representing a 4
percent decrease year-on-year. The Group’s net income
before non-cash M&A related accounting charges
was US$997 million, up 22 percent year-on-year. The
Group’s net income was US$829 million, representing
an increase of 1 percent from the previous fiscal year.