Lenovo 2015 Annual Report Download - page 35
Download and view the complete annual report
Please find page 35 of the 2015 Lenovo annual report below. You can navigate through the pages in the report by either clicking on the pages listed below, or by using the keyword search tool below to find specific information within the annual report.-
 1
1 -
2
-
3
-
4
-
5
-
6
-
7
-
8
-
9
-
10
-
11
-
12
-
13
-
14
-
15
-
16
-
17
-
18
-
19
-
20
-
21
-
22
-
23
-
24
-
 25
25 -
 26
26 -
 27
27 -
 28
28 -
 29
29 -
 30
30 -
 31
31 -
 32
32 -
 33
33 -
 34
34 -
 35
35 -
 36
36 -
 37
37 -
 38
38 -
 39
39 -
 40
40 -
 41
41 -
 42
42 -
 43
43 -
 44
44 -
 45
45 -
46
-
47
-
48
-
49
-
50
-
51
-
52
-
53
-
54
-
55
-
56
-
57
-
58
-
59
-
60
-
61
-
62
-
63
-
64
-
65
-
66
-
67
-
68
-
69
-
70
-
71
-
72
-
73
-
74
-
75
-
76
-
77
-
78
-
79
-
80
-
81
-
82
-
83
-
84
-
85
-
86
-
87
-
88
-
89
-
90
-
91
-
92
-
93
-
94
-
95
-
96
-
97
-
98
-
99
-
100
-
101
-
102
-
103
-
104
-
105
-
106
-
107
-
108
-
109
-
110
-
111
-
112
-
113
-
114
-
115
-
116
-
117
-
118
-
119
-
120
-
121
-
122
-
123
-
124
-
125
-
126
-
127
-
128
-
129
-
130
-
131
-
132
-
133
-
134
-
135
-
136
-
137
-
138
-
139
-
140
-
141
-
142
-
143
-
144
-
145
-
146
-
147
-
148
-
149
-
150
-
151
-
152
-
153
-
154
-
155
-
156
-
157
-
158
-
159
-
160
-
161
-
162
-
163
-
164
-
165
-
166
-
167
-
168
-
169
-
170
-
171
-
172
-
173
-
174
-
175
-
176
-
177
-
178
-
179
-
180
-
181
-
182
-
183
-
184
-
185
-
186
-
187
-
188
-
189
-
190
-
191
-
192
-
193
-
194
-
195
-
196
-
197
-
198
-
199
-
200
-
201
-
202
-
203
-
204
-
205
-
206
-
207
-
208
-
209
-
210
-
211
-
212
-
213
-
214
-
215
 |
 |

33
2014/15 Annual Report Lenovo Group Limited
Results
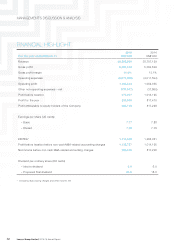
For the year ended March 31, 2015, the Group achieved total sales of approximately US$46,296 million. Profit
attributable to equity holders for the year was approximately US$829 million, representing an increase of US$12
million as compared with last year. Gross profit margin for the year was 1.3 point up from 13.1 percent reported last
year. Basic earnings per share and diluted earnings per share were US7.77 cents and US7.69 cents, representing a
decrease of US0.11 cents and US0.09 cents respectively as compared with last year.
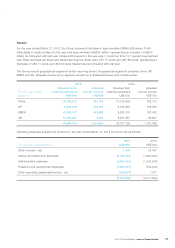
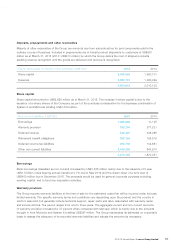
The Group adopts geographical segments as the reporting format. Geographical segments comprise China, AP,
EMEA and AG. Analyses of revenue by segment are set out in Business Review and Outlook below.
2015 2014
For the year ended
March 31
Revenue from
external customers
US$’000
Adjusted
pre-tax income
US$’000
Revenue from
external customers
US$’000
Adjusted
pre-tax income
US$’000
China 14,700,270 794,795 14,725,659 788,130
AP 6,549,339 302,183 6,162,919 109,350
EMEA 12,803,357 410,858 9,580,700 187,482
AG 12,242,627 7,999 8,237,851 68,627
46,295,593 1,515,835 38,707,129 1,153,589
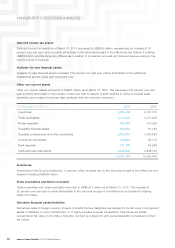
Operating expenses analyzed by function for the year ended March 31, 2015 and 2014 are as follows:
2015 2014
For the year ended March 31 US$’000 US$’000
Other income – net 1,490 22,427
Selling and distribution expenses (2,302,182) (1,900,005)
Administrative expenses (1,883,114) (1,402,979)
Research and development expenses (1,220,919) (732,454)
Other operating (expenses)/income – net (168,574) 1,417
(5,573,299) (4,011,594)