Lenovo 2015 Annual Report Download - page 34
Download and view the complete annual report
Please find page 34 of the 2015 Lenovo annual report below. You can navigate through the pages in the report by either clicking on the pages listed below, or by using the keyword search tool below to find specific information within the annual report.-
 1
1 -
2
-
3
-
4
-
5
-
6
-
7
-
8
-
9
-
10
-
11
-
12
-
13
-
14
-
15
-
16
-
17
-
18
-
19
-
20
-
21
-
22
-
23
-
 24
24 -
 25
25 -
 26
26 -
 27
27 -
 28
28 -
 29
29 -
 30
30 -
 31
31 -
 32
32 -
 33
33 -
 34
34 -
 35
35 -
 36
36 -
 37
37 -
 38
38 -
 39
39 -
 40
40 -
 41
41 -
 42
42 -
 43
43 -
 44
44 -
45
-
46
-
47
-
48
-
49
-
50
-
51
-
52
-
53
-
54
-
55
-
56
-
57
-
58
-
59
-
60
-
61
-
62
-
63
-
64
-
65
-
66
-
67
-
68
-
69
-
70
-
71
-
72
-
73
-
74
-
75
-
76
-
77
-
78
-
79
-
80
-
81
-
82
-
83
-
84
-
85
-
86
-
87
-
88
-
89
-
90
-
91
-
92
-
93
-
94
-
95
-
96
-
97
-
98
-
99
-
100
-
101
-
102
-
103
-
104
-
105
-
106
-
107
-
108
-
109
-
110
-
111
-
112
-
113
-
114
-
115
-
116
-
117
-
118
-
119
-
120
-
121
-
122
-
123
-
124
-
125
-
126
-
127
-
128
-
129
-
130
-
131
-
132
-
133
-
134
-
135
-
136
-
137
-
138
-
139
-
140
-
141
-
142
-
143
-
144
-
145
-
146
-
147
-
148
-
149
-
150
-
151
-
152
-
153
-
154
-
155
-
156
-
157
-
158
-
159
-
160
-
161
-
162
-
163
-
164
-
165
-
166
-
167
-
168
-
169
-
170
-
171
-
172
-
173
-
174
-
175
-
176
-
177
-
178
-
179
-
180
-
181
-
182
-
183
-
184
-
185
-
186
-
187
-
188
-
189
-
190
-
191
-
192
-
193
-
194
-
195
-
196
-
197
-
198
-
199
-
200
-
201
-
202
-
203
-
204
-
205
-
206
-
207
-
208
-
209
-
210
-
211
-
212
-
213
-
214
-
215
 |
 |

32 Lenovo Group Limited 2014/15 Annual Report
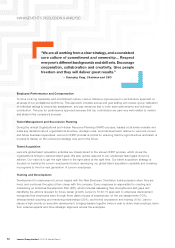
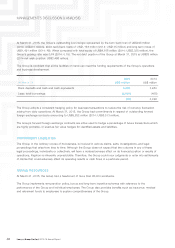
MANAGEMENT’S DISCUSSION & ANALYSIS
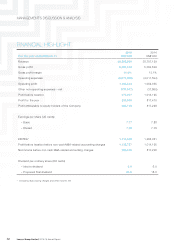
FINANCIAL HIGHLIGHT
For the year ended March 31
2015
US$’000
2014
US$’000
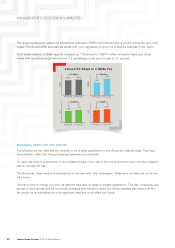
Revenue 46,295,593 38,707,129
Gross profit 6,681,813 5,063,649
Gross profit margin 14.4% 13.1%
Operating expenses (5,573,299) (4,011,594)
Operating profit 1,108,514 1,052,055
Other non-operating expenses – net (137,547) (37,860)
Profit before taxation 970,967 1,014,195
Profit for the year 836,603 817,470
Profit attributable to equity holders of the Company 828,715 817,228
Earnings per share (US cents)
– Basic 7.77 7.88
– Diluted 7.69 7.78
EBITDA* 1,714,829 1,365,061
Profit before taxation before non-cash M&A-related accounting charges 1,138,727 1,014,195
Net income before non-cash M&A related accounting charges 996,475 817,228
Dividend per ordinary share (HK cents)
– Interim dividend 6.0 6.0
– Proposed final dividend 20.5 18.0
* Excluding restructuring charges and other income, net