Lenovo 2015 Annual Report Download - page 188
Download and view the complete annual report
Please find page 188 of the 2015 Lenovo annual report below. You can navigate through the pages in the report by either clicking on the pages listed below, or by using the keyword search tool below to find specific information within the annual report.-
 1
1 -
2
-
3
-
4
-
5
-
6
-
7
-
8
-
9
-
10
-
11
-
12
-
13
-
14
-
15
-
16
-
17
-
18
-
19
-
20
-
21
-
22
-
23
-
24
-
25
-
26
-
27
-
28
-
29
-
30
-
31
-
32
-
33
-
34
-
35
-
36
-
37
-
38
-
39
-
40
-
41
-
42
-
43
-
44
-
45
-
46
-
47
-
48
-
49
-
50
-
51
-
52
-
53
-
54
-
55
-
56
-
57
-
58
-
59
-
60
-
61
-
62
-
63
-
64
-
65
-
66
-
67
-
68
-
69
-
70
-
71
-
72
-
73
-
74
-
75
-
76
-
77
-
78
-
79
-
80
-
81
-
82
-
83
-
84
-
85
-
86
-
87
-
88
-
89
-
90
-
91
-
92
-
93
-
94
-
95
-
96
-
97
-
98
-
99
-
100
-
101
-
102
-
103
-
104
-
105
-
106
-
107
-
108
-
109
-
110
-
111
-
112
-
113
-
114
-
115
-
116
-
117
-
118
-
119
-
120
-
121
-
122
-
123
-
124
-
125
-
126
-
127
-
128
-
129
-
130
-
131
-
132
-
133
-
134
-
135
-
136
-
137
-
138
-
139
-
140
-
141
-
142
-
143
-
144
-
145
-
146
-
147
-
148
-
149
-
150
-
151
-
152
-
153
-
154
-
155
-
156
-
157
-
158
-
159
-
160
-
161
-
162
-
163
-
164
-
165
-
166
-
167
-
168
-
169
-
170
-
171
-
172
-
173
-
174
-
175
-
176
-
177
-
 178
178 -
 179
179 -
 180
180 -
 181
181 -
 182
182 -
 183
183 -
 184
184 -
 185
185 -
 186
186 -
 187
187 -
 188
188 -
 189
189 -
 190
190 -
 191
191 -
 192
192 -
 193
193 -
 194
194 -
 195
195 -
 196
196 -
 197
197 -
 198
198 -
199
-
200
-
201
-
202
-
203
-
204
-
205
-
206
-
207
-
208
-
209
-
210
-
211
-
212
-
213
-
214
-
215
 |
 |

186 Lenovo Group Limited 2014/15 Annual Report
NOTES TO THE FINANCIAL STATEMENTS
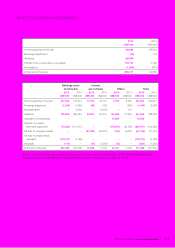
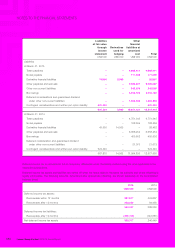
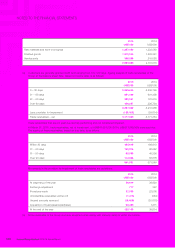
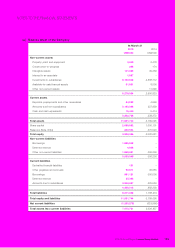
22 INVENTORIES
2015 2014
US$’000 US$’000
Raw materials and work-in-progress 1,387,082 1,222,589
Finished goods 1,212,009 1,263,341
Service parts 396,298 215,085
2,995,389 2,701,015
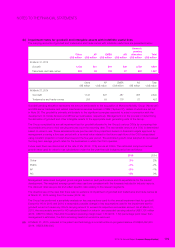
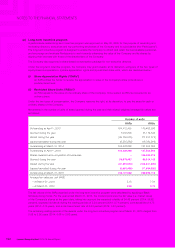
23 RECEIVABLES
(a) Customers are generally granted credit term ranging from 0 to 120 days. Ageing analysis of trade receivables of the
Group at the balance sheet date, based on invoice date, is as follows:
2015 2014
US$’000 US$’000
0 – 30 days 3,669,635 2,206,799
31 – 60 days 881,449 601,499
61 – 90 days 320,591 181,916
Over 90 days 426,267 220,754
5,297,942 3,210,968
Less: provision for impairment (120,102) (39,614)
Trade receivables – net 5,177,840 3,171,354
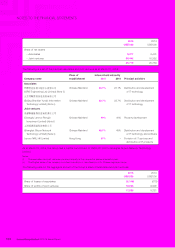
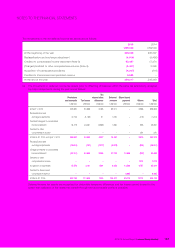
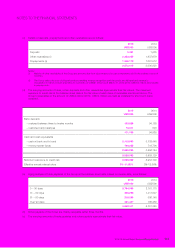
Trade receivables that are not past due are fully performing and not considered impaired.
At March 31, 2015, trade receivables, net of impairment, of US$841,001,000 (2014: US$371,549,000) were past due.
The ageing of these receivables, based on due date, is as follows:
2015 2014
US$’000 US$’000
Within 30 days 465,918 186,913
31 – 60 days 192,276 82,652
61 – 90 days 68,599 45,306
Over 90 days 114,208 56,678
841,001 371,549
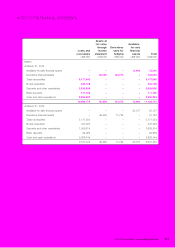
Movements in the provision for impairment of trade receivables are as follows:
2015 2014
US$’000 US$’000
At beginning of the year 39,614 36,920
Exchange adjustment 777 342
Provisions made 37,359 22,000
Uncollectible receivables written off (7,475) (244)
Unused amounts reversed (18,668) (20,675)
Acquisition of businesses/subsidiaries 68,495 1,271
At the end of the year 120,102 39,614
(b) Notes receivable of the Group are bank accepted notes mainly with maturity dates of within six months.