Lenovo 2015 Annual Report Download - page 173
Download and view the complete annual report
Please find page 173 of the 2015 Lenovo annual report below. You can navigate through the pages in the report by either clicking on the pages listed below, or by using the keyword search tool below to find specific information within the annual report.-
 1
1 -
2
-
3
-
4
-
5
-
6
-
7
-
8
-
9
-
10
-
11
-
12
-
13
-
14
-
15
-
16
-
17
-
18
-
19
-
20
-
21
-
22
-
23
-
24
-
25
-
26
-
27
-
28
-
29
-
30
-
31
-
32
-
33
-
34
-
35
-
36
-
37
-
38
-
39
-
40
-
41
-
42
-
43
-
44
-
45
-
46
-
47
-
48
-
49
-
50
-
51
-
52
-
53
-
54
-
55
-
56
-
57
-
58
-
59
-
60
-
61
-
62
-
63
-
64
-
65
-
66
-
67
-
68
-
69
-
70
-
71
-
72
-
73
-
74
-
75
-
76
-
77
-
78
-
79
-
80
-
81
-
82
-
83
-
84
-
85
-
86
-
87
-
88
-
89
-
90
-
91
-
92
-
93
-
94
-
95
-
96
-
97
-
98
-
99
-
100
-
101
-
102
-
103
-
104
-
105
-
106
-
107
-
108
-
109
-
110
-
111
-
112
-
113
-
114
-
115
-
116
-
117
-
118
-
119
-
120
-
121
-
122
-
123
-
124
-
125
-
126
-
127
-
128
-
129
-
130
-
131
-
132
-
133
-
134
-
135
-
136
-
137
-
138
-
139
-
140
-
141
-
142
-
143
-
144
-
145
-
146
-
147
-
148
-
149
-
150
-
151
-
152
-
153
-
154
-
155
-
156
-
157
-
158
-
159
-
160
-
161
-
162
-
 163
163 -
 164
164 -
 165
165 -
 166
166 -
 167
167 -
 168
168 -
 169
169 -
 170
170 -
 171
171 -
 172
172 -
 173
173 -
 174
174 -
 175
175 -
 176
176 -
 177
177 -
 178
178 -
 179
179 -
 180
180 -
 181
181 -
 182
182 -
 183
183 -
184
-
185
-
186
-
187
-
188
-
189
-
190
-
191
-
192
-
193
-
194
-
195
-
196
-
197
-
198
-
199
-
200
-
201
-
202
-
203
-
204
-
205
-
206
-
207
-
208
-
209
-
210
-
211
-
212
-
213
-
214
-
215
 |
 |

171
2014/15 Annual Report Lenovo Group Limited
NOTES TO THE FINANCIAL STATEMENTS
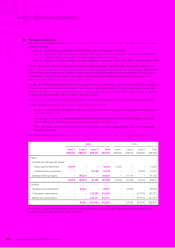
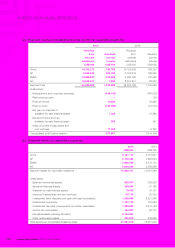
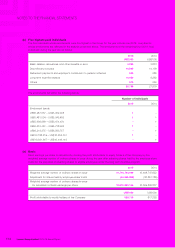
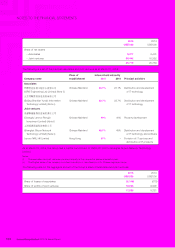
9 TAXATION
The amount of taxation in the consolidated income statement represents:
2015 2014
US$’000 US$’000
Current tax
– Hong Kong profits tax 26,041 13,024
– Taxation outside Hong Kong 193,810 201,175
Deferred tax (Note 20) (85,487) (17,474)
134,364 196,725
Hong Kong profits tax has been provided at the rate of 16.5% (2014: 16.5%) on the estimated assessable profit for the year.
Taxation outside Hong Kong represents income and irrecoverable withholding taxes of subsidiaries operating in the Chinese
Mainland and overseas, calculated at rates applicable in the respective jurisdictions.
The Group has been granted certain tax concessions by tax authorities in the Chinese Mainland and overseas whereby the
subsidiaries operating in the respective jurisdictions are entitled to tax concessions.
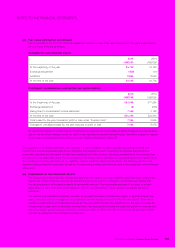
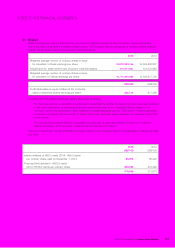
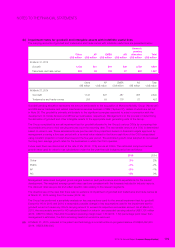
The differences between the Group’s expected tax charge, calculated at the domestic rates applicable to the countries
concerned, and the Group’s tax charge for the year are as follows:
2015 2014
US$’000 US$’000
Profit before taxation 970,967 1,014,195
Tax calculated at domestic rates applicable in countries concerned 228,660 231,160
Income not subject to taxation (393,290) (427,986)
Expenses not deductible for taxation purposes 205,207 192,706
Utilization of previously unrecognized tax losses (31,669) (3,841)
Effect on opening deferred income tax assets due to change in tax rates 10,269 359
Deferred income tax assets not recognized 78,976 151,136
Under-provision in prior years 36,211 53,191
134,364 196,725
The weighted average applicable tax rate for the year was 23.5% (2014: 22.8%).The increase is caused by changes in tax
concessions and profitability of the Group’s subsidiaries in respective countries they are operating.
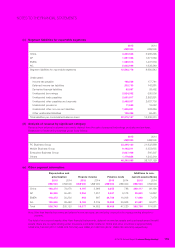
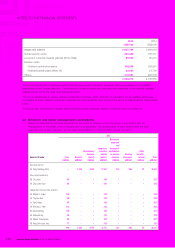
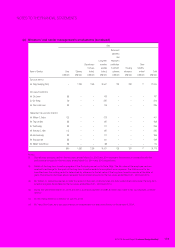
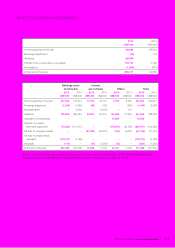
The tax (credit)/charge relating to components of other comprehensive income is as follows:
2015 2014
Before
tax
Tax
(credit)/
charge
After
tax
Before
tax
Tax
charge
After
tax
US$’000 US$’000 US$’000 US$’000 US$’000 US$’000
Fair value change on available-for-sale
financial assets 7,326 –7,326 (2,288) –(2,288)
Investment revaluation reserve
reclassified to consolidated income
statement on disposal of an
available-for-sale financial asset –––(20,526) –(20,526)
Fair value change on cash flow hedges 125,856 (4,565) 121,291 (41,389) 3,101 (38,288)
Remeasurements of post employment
benefit obligations (70,087) 1,114 (68,973) 3,988 189 4,177
Exchange reserve reclassified to
consolidated income statement
on disposal of a subsidiary –––1,250 –1,250
Currency translation differences (598,733) –(598,733) (69,781) –(69,781)
Other comprehensive (loss)/income (535,638) (3,451) (539,089) (128,746) 3,290 (125,456)
Current tax ––
Deferred tax (Note 20) (3,451) 3,290
(3,451) 3,290