Lenovo 2015 Annual Report Download - page 178
Download and view the complete annual report
Please find page 178 of the 2015 Lenovo annual report below. You can navigate through the pages in the report by either clicking on the pages listed below, or by using the keyword search tool below to find specific information within the annual report.-
 1
1 -
2
-
3
-
4
-
5
-
6
-
7
-
8
-
9
-
10
-
11
-
12
-
13
-
14
-
15
-
16
-
17
-
18
-
19
-
20
-
21
-
22
-
23
-
24
-
25
-
26
-
27
-
28
-
29
-
30
-
31
-
32
-
33
-
34
-
35
-
36
-
37
-
38
-
39
-
40
-
41
-
42
-
43
-
44
-
45
-
46
-
47
-
48
-
49
-
50
-
51
-
52
-
53
-
54
-
55
-
56
-
57
-
58
-
59
-
60
-
61
-
62
-
63
-
64
-
65
-
66
-
67
-
68
-
69
-
70
-
71
-
72
-
73
-
74
-
75
-
76
-
77
-
78
-
79
-
80
-
81
-
82
-
83
-
84
-
85
-
86
-
87
-
88
-
89
-
90
-
91
-
92
-
93
-
94
-
95
-
96
-
97
-
98
-
99
-
100
-
101
-
102
-
103
-
104
-
105
-
106
-
107
-
108
-
109
-
110
-
111
-
112
-
113
-
114
-
115
-
116
-
117
-
118
-
119
-
120
-
121
-
122
-
123
-
124
-
125
-
126
-
127
-
128
-
129
-
130
-
131
-
132
-
133
-
134
-
135
-
136
-
137
-
138
-
139
-
140
-
141
-
142
-
143
-
144
-
145
-
146
-
147
-
148
-
149
-
150
-
151
-
152
-
153
-
154
-
155
-
156
-
157
-
158
-
159
-
160
-
161
-
162
-
163
-
164
-
165
-
166
-
167
-
 168
168 -
 169
169 -
 170
170 -
 171
171 -
 172
172 -
 173
173 -
 174
174 -
 175
175 -
 176
176 -
 177
177 -
 178
178 -
 179
179 -
 180
180 -
 181
181 -
 182
182 -
 183
183 -
 184
184 -
 185
185 -
 186
186 -
 187
187 -
 188
188 -
189
-
190
-
191
-
192
-
193
-
194
-
195
-
196
-
197
-
198
-
199
-
200
-
201
-
202
-
203
-
204
-
205
-
206
-
207
-
208
-
209
-
210
-
211
-
212
-
213
-
214
-
215
 |
 |

176 Lenovo Group Limited 2014/15 Annual Report
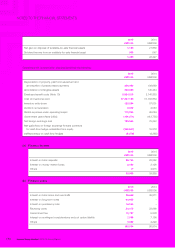
NOTES TO THE FINANCIAL STATEMENTS
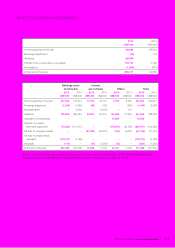
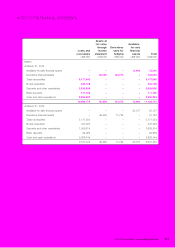
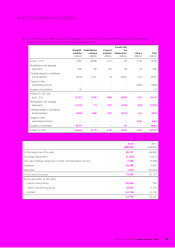
14 PROPERTY, PLANT AND EQUIPMENT
Freehold
land and
buildings
Leasehold
improvements
Plant and
machinery
Furniture
and
fixtures
Office
equipment
Motor
vehicles Total
US$’000 US$’000 US$’000 US$’000 US$’000 US$’000 US$’000
At April 1, 2013
Cost 308,006 136,080 283,548 41,243 286,520 5,760 1,061,157
Accumulated depreciation and
impairment losses 51,910 78,652 222,101 27,221 198,713 2,783 581,380
Net book amount 256,096 57,428 61,447 14,022 87,807 2,977 479,777
Year ended March 31, 2014
Opening net book amount 256,096 57,428 61,447 14,022 87,807 2,977 479,777
Exchange adjustment (5,005) (2,091) (5,013) (538) (1,571) (55) (14,273)
Reclassification (2,106) 2,354 14 82 (344) – –
Additions 10,655 18,579 98,465 3,766 44,903 1,194 177,562
Transfer from
construction-in-progress 76,185 10,711 40,344 5,232 7,930 –140,402
Disposals (3,866) (705) (1,111) (426) (2,456) (186) (8,750)
Depreciation (9,962) (24,543) (30,657) (5,041) (37,651) (1,016) (108,870)
Acquisition of subsidiaries – – 1,565 – – – 1,565
Closing net book amount 321,997 61,733 165,054 17,097 98,618 2,914 667,413
At March 31, 2014
Cost 382,444 162,102 401,012 48,337 307,252 5,910 1,307,057
Accumulated depreciation and
impairment losses 60,447 100,369 235,958 31,240 208,634 2,996 639,644
Net book amount 321,997 61,733 165,054 17,097 98,618 2,914 667,413
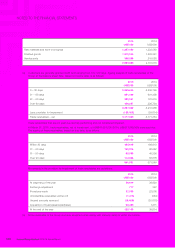
Year ended March 31, 2015
Opening net book amount 321,997 61,733 165,054 17,097 98,618 2,914 667,413
Exchange adjustment (30,185) (4,691) (14,711) (774) (4,979) (653) (55,993)
Reclassification (2) 37 (233) (95) 293 – –
Additions 21,272 43,495 111,362 7,606 73,231 1,633 258,599
Transfer from
construction-in-progress 71,668 163,265 8,020 8,227 721 –251,901
Disposals (3,877) (523) (799) (822) (2,993) (329) (9,343)
Depreciation (14,877) (41,784) (68,367) (7,603) (72,968) (1,365) (206,964)
Acquisition of businesses 91,653 191,759 82,358 6,202 216,854 2,035 590,861
Closing net book amount 457,649 413,291 282,684 29,838 308,777 4,235 1,496,474
At March 31, 2015
Cost 529,592 542,699 563,106 64,860 563,012 7,609 2,270,878
Accumulated depreciation and
impairment losses 71,943 129,408 280,422 35,022 254,235 3,374 774,404
Net book amount 457,649 413,291 282,684 29,838 308,777 4,235 1,496,474