Lenovo 2015 Annual Report Download - page 190
Download and view the complete annual report
Please find page 190 of the 2015 Lenovo annual report below. You can navigate through the pages in the report by either clicking on the pages listed below, or by using the keyword search tool below to find specific information within the annual report.-
 1
1 -
2
-
3
-
4
-
5
-
6
-
7
-
8
-
9
-
10
-
11
-
12
-
13
-
14
-
15
-
16
-
17
-
18
-
19
-
20
-
21
-
22
-
23
-
24
-
25
-
26
-
27
-
28
-
29
-
30
-
31
-
32
-
33
-
34
-
35
-
36
-
37
-
38
-
39
-
40
-
41
-
42
-
43
-
44
-
45
-
46
-
47
-
48
-
49
-
50
-
51
-
52
-
53
-
54
-
55
-
56
-
57
-
58
-
59
-
60
-
61
-
62
-
63
-
64
-
65
-
66
-
67
-
68
-
69
-
70
-
71
-
72
-
73
-
74
-
75
-
76
-
77
-
78
-
79
-
80
-
81
-
82
-
83
-
84
-
85
-
86
-
87
-
88
-
89
-
90
-
91
-
92
-
93
-
94
-
95
-
96
-
97
-
98
-
99
-
100
-
101
-
102
-
103
-
104
-
105
-
106
-
107
-
108
-
109
-
110
-
111
-
112
-
113
-
114
-
115
-
116
-
117
-
118
-
119
-
120
-
121
-
122
-
123
-
124
-
125
-
126
-
127
-
128
-
129
-
130
-
131
-
132
-
133
-
134
-
135
-
136
-
137
-
138
-
139
-
140
-
141
-
142
-
143
-
144
-
145
-
146
-
147
-
148
-
149
-
150
-
151
-
152
-
153
-
154
-
155
-
156
-
157
-
158
-
159
-
160
-
161
-
162
-
163
-
164
-
165
-
166
-
167
-
168
-
169
-
170
-
171
-
172
-
173
-
174
-
175
-
176
-
177
-
178
-
179
-
 180
180 -
 181
181 -
 182
182 -
 183
183 -
 184
184 -
 185
185 -
 186
186 -
 187
187 -
 188
188 -
 189
189 -
 190
190 -
 191
191 -
 192
192 -
 193
193 -
 194
194 -
 195
195 -
 196
196 -
 197
197 -
 198
198 -
 199
199 -
 200
200 -
201
-
202
-
203
-
204
-
205
-
206
-
207
-
208
-
209
-
210
-
211
-
212
-
213
-
214
-
215
 |
 |

188 Lenovo Group Limited 2014/15 Annual Report
NOTES TO THE FINANCIAL STATEMENTS
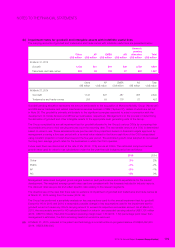
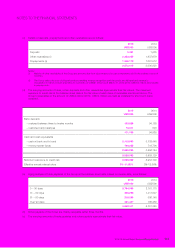
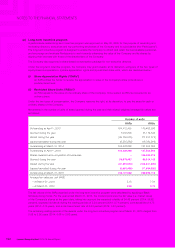
26 PROVISIONS, OTHER PAYABLES AND ACCRUALS
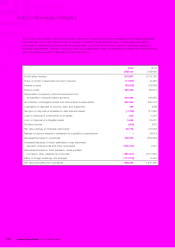
(a) Details of other payables and accruals are as follows:
2015 2014
US$’000 US$’000
Accruals 2,120,381 1,359,002
Allowance for billing adjustments (i) 2,169,767 1,785,022
Other payables (ii) 4,776,339 3,514,230
9,066,487 6,658,254
Notes:
(i) Allowance for billing adjustments relates primarily to allowances for future volume discounts, price protection, rebates, and
customer sales returns.
(ii) Majority of other payables are obligations to pay for finished goods that have been acquired in the ordinary course of business from
subcontractors.
(iii) The carrying amounts of other payables and accruals approximate their fair values.
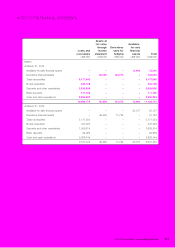
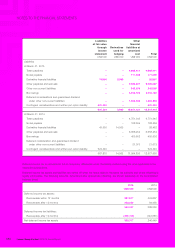
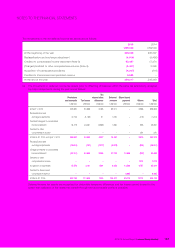
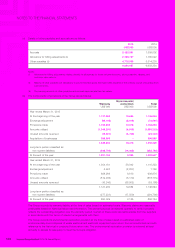
(b) The components of provisions of the Group are as follows:
Warranty
Environmental
restoration Total
US$’000 US$’000 US$’000
Year ended March 31, 2015
At the beginning of the year 1,127,260 19,684 1,146,944
Exchange adjustment (69,142) (2,919) (72,061)
Provisions made 1,153,855 10,378 1,164,233
Amounts utilized (1,049,291) (6,919) (1,056,210)
Unused amounts reversed (19,391) (3,749) (23,140)
Acquisition of businesses 396,563 –396,563
1,539,854 16,475 1,556,329
Long-term portion classified as
non-current liabilities (338,700) (14,082) (352,782)
At the end of the year 1,201,154 2,393 1,203,547
Year ended March 31, 2014
At the beginning of the year 1,054,181 56,042 1,110,223
Exchange adjustment 3,997 (2,837) 1,160
Provisions made 898,264 8,610 906,874
Amounts utilized (812,936) (5,179) (818,115)
Unused amounts reversed (16,246) (36,952) (53,198)
1,127,260 19,684 1,146,944
Long-term portion classified as
non-current liabilities (277,231) (17,559) (294,790)
At the end of the year 850,029 2,125 852,154
The Group records its warranty liability at the time of sales based on estimated costs. Warranty claims are reasonably
predictable based on historical failure rate information. The warranty accrual is reviewed quarterly to verify it properly
reflects the outstanding obligation over the warranty period. Certain of these costs are reimbursable from the suppliers
in accordance with the terms of relevant arrangements with them.
The Group records its environmental restoration provision at the time of sales based on estimated costs of
environmentally-sound disposal of waste electrical and electronic equipment upon return from end-customers and with
reference to the historical or projected future return rate. The environmental restoration provision is reviewed at least
annually to assess its adequacy to meet the Group’s obligation.