Lenovo 2015 Annual Report Download - page 184
Download and view the complete annual report
Please find page 184 of the 2015 Lenovo annual report below. You can navigate through the pages in the report by either clicking on the pages listed below, or by using the keyword search tool below to find specific information within the annual report.-
 1
1 -
2
-
3
-
4
-
5
-
6
-
7
-
8
-
9
-
10
-
11
-
12
-
13
-
14
-
15
-
16
-
17
-
18
-
19
-
20
-
21
-
22
-
23
-
24
-
25
-
26
-
27
-
28
-
29
-
30
-
31
-
32
-
33
-
34
-
35
-
36
-
37
-
38
-
39
-
40
-
41
-
42
-
43
-
44
-
45
-
46
-
47
-
48
-
49
-
50
-
51
-
52
-
53
-
54
-
55
-
56
-
57
-
58
-
59
-
60
-
61
-
62
-
63
-
64
-
65
-
66
-
67
-
68
-
69
-
70
-
71
-
72
-
73
-
74
-
75
-
76
-
77
-
78
-
79
-
80
-
81
-
82
-
83
-
84
-
85
-
86
-
87
-
88
-
89
-
90
-
91
-
92
-
93
-
94
-
95
-
96
-
97
-
98
-
99
-
100
-
101
-
102
-
103
-
104
-
105
-
106
-
107
-
108
-
109
-
110
-
111
-
112
-
113
-
114
-
115
-
116
-
117
-
118
-
119
-
120
-
121
-
122
-
123
-
124
-
125
-
126
-
127
-
128
-
129
-
130
-
131
-
132
-
133
-
134
-
135
-
136
-
137
-
138
-
139
-
140
-
141
-
142
-
143
-
144
-
145
-
146
-
147
-
148
-
149
-
150
-
151
-
152
-
153
-
154
-
155
-
156
-
157
-
158
-
159
-
160
-
161
-
162
-
163
-
164
-
165
-
166
-
167
-
168
-
169
-
170
-
171
-
172
-
173
-
 174
174 -
 175
175 -
 176
176 -
 177
177 -
 178
178 -
 179
179 -
 180
180 -
 181
181 -
 182
182 -
 183
183 -
 184
184 -
 185
185 -
 186
186 -
 187
187 -
 188
188 -
 189
189 -
 190
190 -
 191
191 -
 192
192 -
 193
193 -
 194
194 -
195
-
196
-
197
-
198
-
199
-
200
-
201
-
202
-
203
-
204
-
205
-
206
-
207
-
208
-
209
-
210
-
211
-
212
-
213
-
214
-
215
 |
 |

182 Lenovo Group Limited 2014/15 Annual Report
NOTES TO THE FINANCIAL STATEMENTS
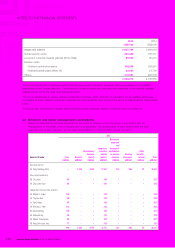
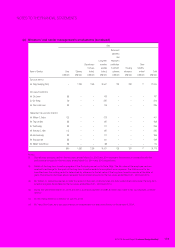
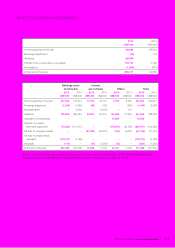
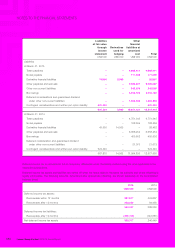
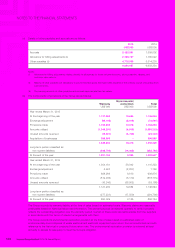
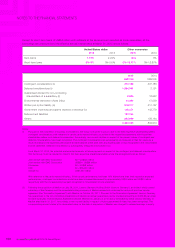
19 FINANCIAL INSTRUMENTS BY CATEGORY (continued)
Liabilities
at fair value
through
income
statement
Derivatives
used for
hedging
Other
financial
liabilities at
amortized
cost Total
US$’000 US$’000 US$’000 US$’000
Liabilities
At March 31, 2015
Trade payables – – 4,662,411 4,662,411
Notes payable – – 171,049 171,049
Derivative financial liabilities 74,904 5,993 – 80,897
Other payables and accruals – – 9,066,487 9,066,487
Other non-current liabilities – – 242,506 242,506
Borrowings – – 3,054,122 3,054,122
Deferred considerations and guaranteed dividend
under other non-current liabilities – – 1,404,546 1,404,546
Contingent considerations and written put option liability 531,400 – – 531,400
606,304 5,993 18,601,121 19,213,418
At March 31, 2014
Trade payables – – 4,751,345 4,751,345
Notes payable – – 108,559 108,559
Derivative financial liabilities 43,530 14,932 –58,462
Other payables and accruals – – 6,658,254 6,658,254
Borrowings – – 455,602 455,602
Deferred consideration and guaranteed dividend
under other non-current liabilities – – 21,073 21,073
Contingent considerations and written put option liability 524,340 – – 524,340
567,870 14,932 11,994,833 12,577,635
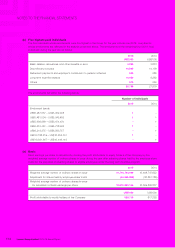
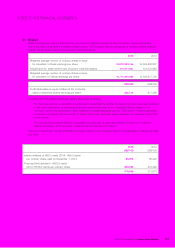
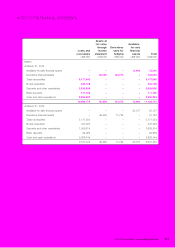
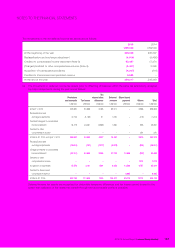
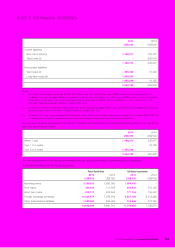
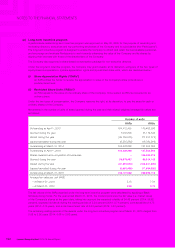
20 DEFERRED INCOME TAX ASSETS AND LIABILITIES
Deferred income tax is calculated in full on temporary differences under the liability method using the rates applicable in the
respective jurisdictions.
Deferred income tax assets and liabilities are netted off when the taxes relate to the same tax authority and where offsetting is
legally enforceable. The following amounts, determined after appropriate offsetting, are shown separately on the consolidated
balance sheet:
2015 2014
US$’000 US$’000
Deferred income tax assets:
Recoverable within 12 months 327,817 324,837
Recoverable after 12 months 202,230 64,493
530,047 389,330
Deferred income tax liabilities:
Recoverable after 12 months (200,730) (142,881)
Net deferred income tax assets 329,317 246,449