Lenovo 2015 Annual Report Download - page 37
Download and view the complete annual report
Please find page 37 of the 2015 Lenovo annual report below. You can navigate through the pages in the report by either clicking on the pages listed below, or by using the keyword search tool below to find specific information within the annual report.-
 1
1 -
2
-
3
-
4
-
5
-
6
-
7
-
8
-
9
-
10
-
11
-
12
-
13
-
14
-
15
-
16
-
17
-
18
-
19
-
20
-
21
-
22
-
23
-
24
-
25
-
26
-
 27
27 -
 28
28 -
 29
29 -
 30
30 -
 31
31 -
 32
32 -
 33
33 -
 34
34 -
 35
35 -
 36
36 -
 37
37 -
 38
38 -
 39
39 -
 40
40 -
 41
41 -
 42
42 -
 43
43 -
 44
44 -
 45
45 -
 46
46 -
 47
47 -
48
-
49
-
50
-
51
-
52
-
53
-
54
-
55
-
56
-
57
-
58
-
59
-
60
-
61
-
62
-
63
-
64
-
65
-
66
-
67
-
68
-
69
-
70
-
71
-
72
-
73
-
74
-
75
-
76
-
77
-
78
-
79
-
80
-
81
-
82
-
83
-
84
-
85
-
86
-
87
-
88
-
89
-
90
-
91
-
92
-
93
-
94
-
95
-
96
-
97
-
98
-
99
-
100
-
101
-
102
-
103
-
104
-
105
-
106
-
107
-
108
-
109
-
110
-
111
-
112
-
113
-
114
-
115
-
116
-
117
-
118
-
119
-
120
-
121
-
122
-
123
-
124
-
125
-
126
-
127
-
128
-
129
-
130
-
131
-
132
-
133
-
134
-
135
-
136
-
137
-
138
-
139
-
140
-
141
-
142
-
143
-
144
-
145
-
146
-
147
-
148
-
149
-
150
-
151
-
152
-
153
-
154
-
155
-
156
-
157
-
158
-
159
-
160
-
161
-
162
-
163
-
164
-
165
-
166
-
167
-
168
-
169
-
170
-
171
-
172
-
173
-
174
-
175
-
176
-
177
-
178
-
179
-
180
-
181
-
182
-
183
-
184
-
185
-
186
-
187
-
188
-
189
-
190
-
191
-
192
-
193
-
194
-
195
-
196
-
197
-
198
-
199
-
200
-
201
-
202
-
203
-
204
-
205
-
206
-
207
-
208
-
209
-
210
-
211
-
212
-
213
-
214
-
215
 |
 |

35
2014/15 Annual Report Lenovo Group Limited
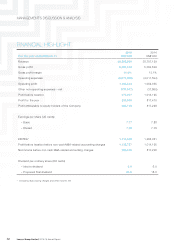
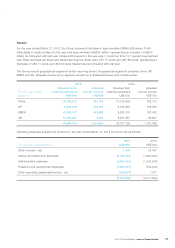
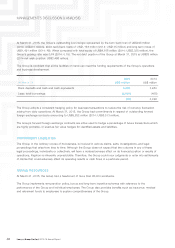
FINANCIAL POSITION
The Group’s major balance sheet items are set out below:
Non-current assets (US$’000) 2015 2014
Property, plant and equipment 1,496,474 667,413
Prepaid lease payments 225,111 40,884
Construction-in-progress 311,888 351,934
Intangible assets 8,929,713 3,339,516
Interests in associates and joint ventures 45,719 20,753
Deferred income tax assets 530,047 389,330
Available-for-sale financial assets 73,400 35,157
Other non-current assets 41,191 111,558
11,653,543 4,956,545
Property, plant and equipment
Property, plant and equipment comprises mainly the Group’s freehold land and buildings, plant and machinery
and office equipment. Increase of 124 percent is mainly attributable to the amounts brought in from Motorola and
System X totalling US$591 million and the completion of the manufacturing plants in China and the Group’s further
investments in the laboratory facilities.
Prepaid lease payments
Prepaid lease payments represent the land use right in respect of the manufacturing sites, staff quarters and
headquarters in China. The increase of 451 percent is due to additions in the land use right in respect of the
research and development sites in Shanghai and Wuhan, China, and staff quarters in Wuhan and Hefei, China
Construction-in-progress
Construction-in-progress comprises mainly the Group’s investments in the headquarters in Beijing, China, the
manufacturing facilities and staff quarters in China and the information technology systems.
Intangible assets
Intangible assets comprise goodwill and other intangible assets including trademarks and trade names, and internal
use software. During the year, the Group completed two business combination activities. Goodwill and other
intangible assets including trademarks and trade names, customer relationships and patent and technology of
US$2,723 million and US$3,098 million were recognised respectively.
Interests in associates and joint ventures
Interests in associates and joint ventures increased by 120 percent over last year, mainly brought about by additional
investments and share of profits from principal business activities of respective associates and joint ventures during
the year.