Lenovo 2015 Annual Report Download - page 180
Download and view the complete annual report
Please find page 180 of the 2015 Lenovo annual report below. You can navigate through the pages in the report by either clicking on the pages listed below, or by using the keyword search tool below to find specific information within the annual report.-
 1
1 -
2
-
3
-
4
-
5
-
6
-
7
-
8
-
9
-
10
-
11
-
12
-
13
-
14
-
15
-
16
-
17
-
18
-
19
-
20
-
21
-
22
-
23
-
24
-
25
-
26
-
27
-
28
-
29
-
30
-
31
-
32
-
33
-
34
-
35
-
36
-
37
-
38
-
39
-
40
-
41
-
42
-
43
-
44
-
45
-
46
-
47
-
48
-
49
-
50
-
51
-
52
-
53
-
54
-
55
-
56
-
57
-
58
-
59
-
60
-
61
-
62
-
63
-
64
-
65
-
66
-
67
-
68
-
69
-
70
-
71
-
72
-
73
-
74
-
75
-
76
-
77
-
78
-
79
-
80
-
81
-
82
-
83
-
84
-
85
-
86
-
87
-
88
-
89
-
90
-
91
-
92
-
93
-
94
-
95
-
96
-
97
-
98
-
99
-
100
-
101
-
102
-
103
-
104
-
105
-
106
-
107
-
108
-
109
-
110
-
111
-
112
-
113
-
114
-
115
-
116
-
117
-
118
-
119
-
120
-
121
-
122
-
123
-
124
-
125
-
126
-
127
-
128
-
129
-
130
-
131
-
132
-
133
-
134
-
135
-
136
-
137
-
138
-
139
-
140
-
141
-
142
-
143
-
144
-
145
-
146
-
147
-
148
-
149
-
150
-
151
-
152
-
153
-
154
-
155
-
156
-
157
-
158
-
159
-
160
-
161
-
162
-
163
-
164
-
165
-
166
-
167
-
168
-
169
-
 170
170 -
 171
171 -
 172
172 -
 173
173 -
 174
174 -
 175
175 -
 176
176 -
 177
177 -
 178
178 -
 179
179 -
 180
180 -
 181
181 -
 182
182 -
 183
183 -
 184
184 -
 185
185 -
 186
186 -
 187
187 -
 188
188 -
 189
189 -
 190
190 -
191
-
192
-
193
-
194
-
195
-
196
-
197
-
198
-
199
-
200
-
201
-
202
-
203
-
204
-
205
-
206
-
207
-
208
-
209
-
210
-
211
-
212
-
213
-
214
-
215
 |
 |

178 Lenovo Group Limited 2014/15 Annual Report
NOTES TO THE FINANCIAL STATEMENTS
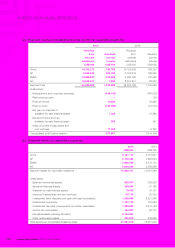
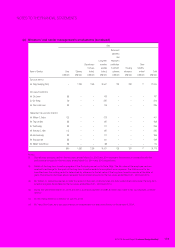
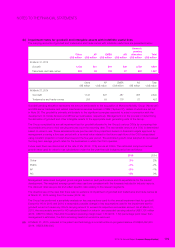
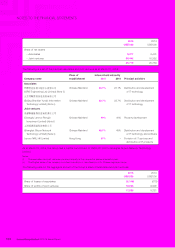
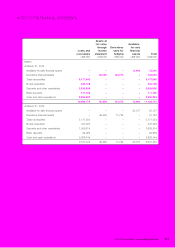
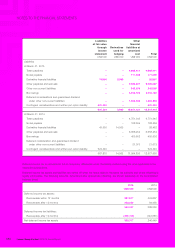
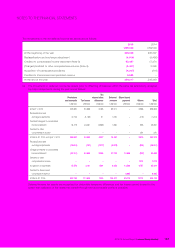
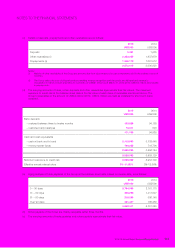
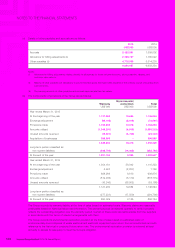
17 INTANGIBLE ASSETS
(a)
Goodwill
(Note (b))
Trademarks
and trade
names
(Note (b))
Internal
use
software
Customer
relation-
ships
Patent and
technology
(Note (c)) Total
US$’000 US$’000 US$’000 US$’000 US$’000 US$’000
At April 1, 2013
Cost 2,403,980 591,447 724,817 173,268 137,906 4,031,418
Accumulated amortization and
impairment losses –130,590 429,984 35,728 108,698 705,000
Net book amount 2,403,980 460,857 294,833 137,540 29,208 3,326,418
Year ended March 31, 2014
Opening net book amount 2,403,980 460,857 294,833 137,540 29,208 3,326,418
Exchange adjustment (47,685) 4,086 (641) 908 (632) (43,964)
Reclassification – – (59,680) –59,680 –
Additions –111 61,001 395 48,037 109,544
Transfer from
construction-in-progress – – 54,337 4,092 13,041 71,470
Disposals – – (12,111) –(562) (12,673)
Amortization –(2,011) (110,883) (11,937) (20,613) (145,444)
Acquisition of subsidiaries 33,527 (1,514) –2,152 –34,165
Closing net book amount 2,389,822 461,529 226,856 133,150 128,159 3,339,516
At March 31, 2014
Cost 2,389,822 594,084 715,182 181,468 302,686 4,183,242
Accumulated amortization and
impairment losses –132,555 488,326 48,318 174,527 843,726
Net book amount 2,389,822 461,529 226,856 133,150 128,159 3,339,516
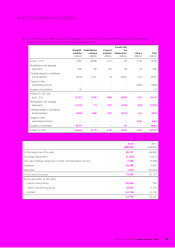
Year ended March 31, 2015
Opening net book amount 2,389,822 461,529 226,856 133,150 128,159 3,339,516
Exchange adjustment (188,879) (17,990) –(48,283) (472) (255,624)
Reclassification – – 173 –(173) –
Additions – – 36,936 –259,753 296,689
Transfer from
construction-in-progress – – 31,052 –144 31,196
Disposals – – (1,999) –(657) (2,656)
Amortization –(19,964) (90,046) (65,847) (124,523) (300,380)
Acquisition of businesses 2,723,254 860,000 –1,289,999 947,719 5,820,972
Closing net book amount 4,924,197 1,283,575 202,972 1,309,019 1,209,950 8,929,713
At March 31, 2015
Cost 4,924,197 1,435,461 767,962 1,416,282 1,505,808 10,049,710
Accumulated amortization and
impairment losses –151,886 564,990 107,263 295,858 1,119,997
Net book amount 4,924,197 1,283,575 202,972 1,309,019 1,209,950 8,929,713
Amortization of US$12,503,000 (2014: US$18,281,000), US$8,562,000 (2014: US$8,263,000), US$221,967,000 (2014:
US$91,312,000) and US$57,348,000 (2014: US$27,588,000) are included in the ‘cost of sales’, ‘selling and distribution
expenses’, ‘administrative expenses’ and ‘research and development expenses’ in the consolidated income statement
respectively.