Lenovo 2015 Annual Report Download - page 144
Download and view the complete annual report
Please find page 144 of the 2015 Lenovo annual report below. You can navigate through the pages in the report by either clicking on the pages listed below, or by using the keyword search tool below to find specific information within the annual report.-
 1
1 -
2
-
3
-
4
-
5
-
6
-
7
-
8
-
9
-
10
-
11
-
12
-
13
-
14
-
15
-
16
-
17
-
18
-
19
-
20
-
21
-
22
-
23
-
24
-
25
-
26
-
27
-
28
-
29
-
30
-
31
-
32
-
33
-
34
-
35
-
36
-
37
-
38
-
39
-
40
-
41
-
42
-
43
-
44
-
45
-
46
-
47
-
48
-
49
-
50
-
51
-
52
-
53
-
54
-
55
-
56
-
57
-
58
-
59
-
60
-
61
-
62
-
63
-
64
-
65
-
66
-
67
-
68
-
69
-
70
-
71
-
72
-
73
-
74
-
75
-
76
-
77
-
78
-
79
-
80
-
81
-
82
-
83
-
84
-
85
-
86
-
87
-
88
-
89
-
90
-
91
-
92
-
93
-
94
-
95
-
96
-
97
-
98
-
99
-
100
-
101
-
102
-
103
-
104
-
105
-
106
-
107
-
108
-
109
-
110
-
111
-
112
-
113
-
114
-
115
-
116
-
117
-
118
-
119
-
120
-
121
-
122
-
123
-
124
-
125
-
126
-
127
-
128
-
129
-
130
-
131
-
132
-
133
-
 134
134 -
 135
135 -
 136
136 -
 137
137 -
 138
138 -
 139
139 -
 140
140 -
 141
141 -
 142
142 -
 143
143 -
 144
144 -
 145
145 -
 146
146 -
 147
147 -
 148
148 -
 149
149 -
 150
150 -
 151
151 -
 152
152 -
 153
153 -
 154
154 -
155
-
156
-
157
-
158
-
159
-
160
-
161
-
162
-
163
-
164
-
165
-
166
-
167
-
168
-
169
-
170
-
171
-
172
-
173
-
174
-
175
-
176
-
177
-
178
-
179
-
180
-
181
-
182
-
183
-
184
-
185
-
186
-
187
-
188
-
189
-
190
-
191
-
192
-
193
-
194
-
195
-
196
-
197
-
198
-
199
-
200
-
201
-
202
-
203
-
204
-
205
-
206
-
207
-
208
-
209
-
210
-
211
-
212
-
213
-
214
-
215
 |
 |

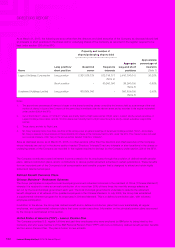
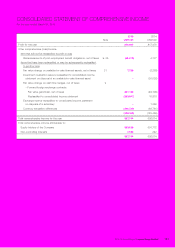
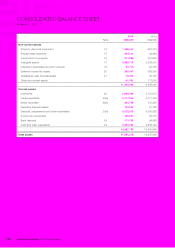
142 Lenovo Group Limited 2014/15 Annual Report
CONSOLIDATED BALANCE SHEET
At March 31, 2015
Note
2015
US$’000
2014
US$’000
Non-current assets
Property, plant and equipment 14 1,496,474 667,413
Prepaid lease payments 15 225,111 40,884
Construction-in-progress 16 311,888 351,934
Intangible assets 17 8,929,713 3,339,516
Interests in associates and joint ventures 18 45,719 20,753
Deferred income tax assets 20 530,047 389,330
Available-for-sale financial assets 21 73,400 35,157
Other non-current assets 41,191 111,558
11,653,543 4,956,545
Current assets
Inventories 22 2,995,389 2,701,015
Trade receivables 23(a) 5,177,840 3,171,354
Notes receivable 23(b) 334,738 447,325
Derivative financial assets 184,534 61,184
Deposits, prepayments and other receivables 23(c) 3,572,015 3,000,826
Income tax recoverable 136,857 65,715
Bank deposits 24 171,139 94,985
Cash and cash equivalents 24 2,855,223 3,858,144
15,427,735 13,400,548
Total assets 27,081,278 18,357,093