Lenovo 2015 Annual Report Download - page 170
Download and view the complete annual report
Please find page 170 of the 2015 Lenovo annual report below. You can navigate through the pages in the report by either clicking on the pages listed below, or by using the keyword search tool below to find specific information within the annual report.-
 1
1 -
2
-
3
-
4
-
5
-
6
-
7
-
8
-
9
-
10
-
11
-
12
-
13
-
14
-
15
-
16
-
17
-
18
-
19
-
20
-
21
-
22
-
23
-
24
-
25
-
26
-
27
-
28
-
29
-
30
-
31
-
32
-
33
-
34
-
35
-
36
-
37
-
38
-
39
-
40
-
41
-
42
-
43
-
44
-
45
-
46
-
47
-
48
-
49
-
50
-
51
-
52
-
53
-
54
-
55
-
56
-
57
-
58
-
59
-
60
-
61
-
62
-
63
-
64
-
65
-
66
-
67
-
68
-
69
-
70
-
71
-
72
-
73
-
74
-
75
-
76
-
77
-
78
-
79
-
80
-
81
-
82
-
83
-
84
-
85
-
86
-
87
-
88
-
89
-
90
-
91
-
92
-
93
-
94
-
95
-
96
-
97
-
98
-
99
-
100
-
101
-
102
-
103
-
104
-
105
-
106
-
107
-
108
-
109
-
110
-
111
-
112
-
113
-
114
-
115
-
116
-
117
-
118
-
119
-
120
-
121
-
122
-
123
-
124
-
125
-
126
-
127
-
128
-
129
-
130
-
131
-
132
-
133
-
134
-
135
-
136
-
137
-
138
-
139
-
140
-
141
-
142
-
143
-
144
-
145
-
146
-
147
-
148
-
149
-
150
-
151
-
152
-
153
-
154
-
155
-
156
-
157
-
158
-
159
-
 160
160 -
 161
161 -
 162
162 -
 163
163 -
 164
164 -
 165
165 -
 166
166 -
 167
167 -
 168
168 -
 169
169 -
 170
170 -
 171
171 -
 172
172 -
 173
173 -
 174
174 -
 175
175 -
 176
176 -
 177
177 -
 178
178 -
 179
179 -
 180
180 -
181
-
182
-
183
-
184
-
185
-
186
-
187
-
188
-
189
-
190
-
191
-
192
-
193
-
194
-
195
-
196
-
197
-
198
-
199
-
200
-
201
-
202
-
203
-
204
-
205
-
206
-
207
-
208
-
209
-
210
-
211
-
212
-
213
-
214
-
215
 |
 |

168 Lenovo Group Limited 2014/15 Annual Report
NOTES TO THE FINANCIAL STATEMENTS
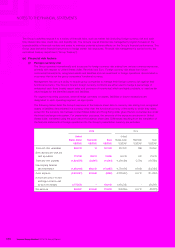
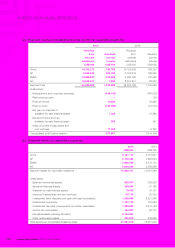
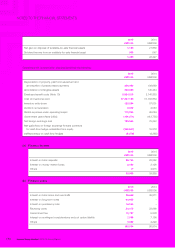
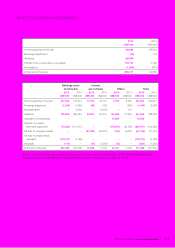
5 SEGMENT INFORMATION (continued)
(a) Segment revenue and adjusted pre-tax income for reportable segments
2015 2014
Revenue
from
external
customers
Adjusted
pre-tax
income
Revenue
from
external
customers
Adjusted
pre-tax
income
US$’000 US$’000 US$’000 US$’000
China 14,700,270 794,795 14,725,659 788,130
AP 6,549,339 302,183 6,162,919 109,350
EMEA 12,803,357 410,858 9,580,700 187,482
AG 12,242,627 7,999 8,237,851 68,627
Segment total 46,295,593 1,515,835 38,707,129 1,153,589
Unallocated:
Headquarters and corporate expenses (449,142) (156,502)
Restructuring costs –(26)
Finance income 14,825 19,240
Finance costs (129,096) (33,754)
Net gain on disposal of
available-for-sale financial assets 1,185 21,880
Dividend income from an
available-for-sale financial asset 305 547
Share of profits of associates and
joint ventures 17,055 9,221
Consolidated profit before taxation 970,967 1,014,195
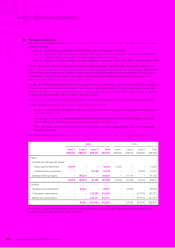
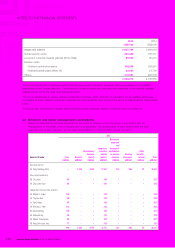
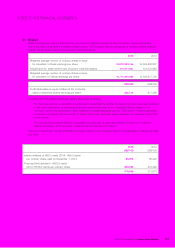
(b) Segment assets for reportable segments
2015 2014
US$’000 US$’000
China 6,157,774 5,157,241
AP 2,179,482 1,993,624
EMEA 2,808,546 2,341,114
AG 5,059,385 2,559,869
Segment assets for reportable segments 16,205,187 12,051,848
Unallocated:
Deferred income tax assets 530,047 389,330
Derivative financial assets 184,534 61,184
Available-for-sale financial assets 73,400 35,157
Interests in associates and joint ventures 45,719 20,753
Unallocated bank deposits and cash and cash equivalents 1,259,658 2,521,366
Unallocated inventories 1,131,779 757,648
Unallocated deposits, prepayments and other receivables 1,508,524 2,214,124
Income tax recoverable 136,857 65,715
Intangible assets pending allocation 5,706,000 –
Other unallocated assets 299,573 239,968
Total assets per consolidated balance sheet 27,081,278 18,357,093