Lenovo 2015 Annual Report Download - page 194
Download and view the complete annual report
Please find page 194 of the 2015 Lenovo annual report below. You can navigate through the pages in the report by either clicking on the pages listed below, or by using the keyword search tool below to find specific information within the annual report.-
 1
1 -
2
-
3
-
4
-
5
-
6
-
7
-
8
-
9
-
10
-
11
-
12
-
13
-
14
-
15
-
16
-
17
-
18
-
19
-
20
-
21
-
22
-
23
-
24
-
25
-
26
-
27
-
28
-
29
-
30
-
31
-
32
-
33
-
34
-
35
-
36
-
37
-
38
-
39
-
40
-
41
-
42
-
43
-
44
-
45
-
46
-
47
-
48
-
49
-
50
-
51
-
52
-
53
-
54
-
55
-
56
-
57
-
58
-
59
-
60
-
61
-
62
-
63
-
64
-
65
-
66
-
67
-
68
-
69
-
70
-
71
-
72
-
73
-
74
-
75
-
76
-
77
-
78
-
79
-
80
-
81
-
82
-
83
-
84
-
85
-
86
-
87
-
88
-
89
-
90
-
91
-
92
-
93
-
94
-
95
-
96
-
97
-
98
-
99
-
100
-
101
-
102
-
103
-
104
-
105
-
106
-
107
-
108
-
109
-
110
-
111
-
112
-
113
-
114
-
115
-
116
-
117
-
118
-
119
-
120
-
121
-
122
-
123
-
124
-
125
-
126
-
127
-
128
-
129
-
130
-
131
-
132
-
133
-
134
-
135
-
136
-
137
-
138
-
139
-
140
-
141
-
142
-
143
-
144
-
145
-
146
-
147
-
148
-
149
-
150
-
151
-
152
-
153
-
154
-
155
-
156
-
157
-
158
-
159
-
160
-
161
-
162
-
163
-
164
-
165
-
166
-
167
-
168
-
169
-
170
-
171
-
172
-
173
-
174
-
175
-
176
-
177
-
178
-
179
-
180
-
181
-
182
-
183
-
 184
184 -
 185
185 -
 186
186 -
 187
187 -
 188
188 -
 189
189 -
 190
190 -
 191
191 -
 192
192 -
 193
193 -
 194
194 -
 195
195 -
 196
196 -
 197
197 -
 198
198 -
 199
199 -
 200
200 -
 201
201 -
 202
202 -
 203
203 -
 204
204 -
205
-
206
-
207
-
208
-
209
-
210
-
211
-
212
-
213
-
214
-
215
 |
 |

192 Lenovo Group Limited 2014/15 Annual Report
NOTES TO THE FINANCIAL STATEMENTS
29 SHARE CAPITAL (continued)
(a) Long-term incentive program
A performance-related long-term incentive program was approved on May 26, 2005 for the purpose of rewarding and
motivating directors, executives and top-performing employees of the Company and its subsidiaries (the “Participants”).
The long-term incentive program is designed to enable the Company to attract and retain the best available personnel,
and encourage and motivate Participants to work towards enhancing the value of the Company and its shares by
aligning their interests with those of the shareholders of the Company.
The Company also approved a share-based compensation package for non-executive directors.
Under the long-term incentive program, the Company may grant awards, at its discretion, using any of the two types of
equity-based compensation: (i) share appreciation rights and (ii) restricted share units, which are described below:
(i) Share Appreciation Rights (“SARs”)
An SAR entitles the holder to receive the appreciation in value of the Company’s share price above a
predetermined level.
(ii) Restricted Share Units (“RSUs”)
An RSU equals to the value of one ordinary share of the Company. Once vested, an RSU is converted to an
ordinary share.
Under the two types of compensation, the Company reserves the right, at its discretion, to pay the award in cash or
ordinary shares of the Company.
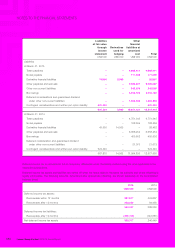
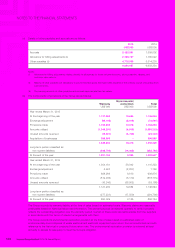
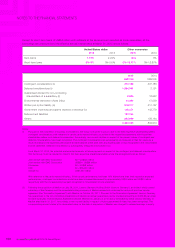
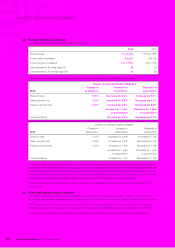
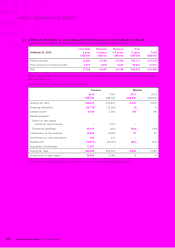
Movements in the number of units of award granted during the year and their related weighted average fair values are
as follows:
Number of units
SARs RSUs
Outstanding at April 1, 2013 164,412,435 170,406,536
Granted during the year 7,057,800 55,119,546
Vested during the year (59,706,679) (71,231,773)
Lapsed/cancelled during the year (8,535,288) (16,790,916)
Outstanding at March 31, 2014 103,228,268 137,503,393
Outstanding at April 1, 2014 103,228,268 137,503,393
Shares awarded upon acquisition of businesses –146,594,218
Granted during the year 84,979,487 90,514,143
Vested during the year (47,499,634) (134,431,685)
Lapsed/cancelled during the year (6,600,459) (17,684,353)
Outstanding at March 31, 2015 134,107,662 222,495,716
Average fair value per unit (HK$)
– At March 31, 2014 2.15 7.34
– At March 31, 2015 2.39 9.73
The fair values of the SARs awarded under the long-term incentive program were calculated by applying a Black-
Scholes pricing model. For the year ended March 31, 2015, the model inputs were the fair value (i.e. market value)
of the Company’s shares at the grant date, taking into account the expected volatility of 34.48 percent (2014: 36.62
percent), expected dividends during the vesting periods of 2.23 percent (2014: 2.71 percent), contractual life of 4.75
years (2014: 4.75 years), and a risk-free interest rate of 0.64 percent (2014: 0.67 percent).
The remaining vesting periods of the awards under the long-term incentive program as at March 31, 2015 ranged from
0.08 to 3.92 years (2014: 0.08 to 3.92 years).