Lenovo 2015 Annual Report Download - page 146
Download and view the complete annual report
Please find page 146 of the 2015 Lenovo annual report below. You can navigate through the pages in the report by either clicking on the pages listed below, or by using the keyword search tool below to find specific information within the annual report.-
 1
1 -
2
-
3
-
4
-
5
-
6
-
7
-
8
-
9
-
10
-
11
-
12
-
13
-
14
-
15
-
16
-
17
-
18
-
19
-
20
-
21
-
22
-
23
-
24
-
25
-
26
-
27
-
28
-
29
-
30
-
31
-
32
-
33
-
34
-
35
-
36
-
37
-
38
-
39
-
40
-
41
-
42
-
43
-
44
-
45
-
46
-
47
-
48
-
49
-
50
-
51
-
52
-
53
-
54
-
55
-
56
-
57
-
58
-
59
-
60
-
61
-
62
-
63
-
64
-
65
-
66
-
67
-
68
-
69
-
70
-
71
-
72
-
73
-
74
-
75
-
76
-
77
-
78
-
79
-
80
-
81
-
82
-
83
-
84
-
85
-
86
-
87
-
88
-
89
-
90
-
91
-
92
-
93
-
94
-
95
-
96
-
97
-
98
-
99
-
100
-
101
-
102
-
103
-
104
-
105
-
106
-
107
-
108
-
109
-
110
-
111
-
112
-
113
-
114
-
115
-
116
-
117
-
118
-
119
-
120
-
121
-
122
-
123
-
124
-
125
-
126
-
127
-
128
-
129
-
130
-
131
-
132
-
133
-
134
-
135
-
 136
136 -
 137
137 -
 138
138 -
 139
139 -
 140
140 -
 141
141 -
 142
142 -
 143
143 -
 144
144 -
 145
145 -
 146
146 -
 147
147 -
 148
148 -
 149
149 -
 150
150 -
 151
151 -
 152
152 -
 153
153 -
 154
154 -
 155
155 -
 156
156 -
157
-
158
-
159
-
160
-
161
-
162
-
163
-
164
-
165
-
166
-
167
-
168
-
169
-
170
-
171
-
172
-
173
-
174
-
175
-
176
-
177
-
178
-
179
-
180
-
181
-
182
-
183
-
184
-
185
-
186
-
187
-
188
-
189
-
190
-
191
-
192
-
193
-
194
-
195
-
196
-
197
-
198
-
199
-
200
-
201
-
202
-
203
-
204
-
205
-
206
-
207
-
208
-
209
-
210
-
211
-
212
-
213
-
214
-
215
 |
 |

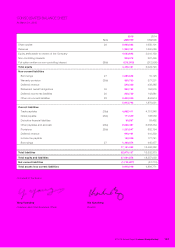
144 Lenovo Group Limited 2014/15 Annual Report
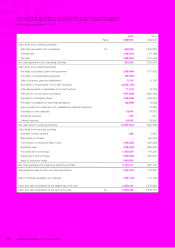
CONSOLIDATED CASH FLOW STATEMENT
For the year ended March 31, 2015
Note
2015
US$’000
2014
US$’000
Cash flows from operating activities
Net cash generated from operations 34 669,020 1,640,386
Interest paid (133,547) (71,199)
Tax paid (296,981) (137,129)
Net cash generated from operating activities 238,492 1,432,058
Cash flows from investing activities
Purchase of property, plant and equipment (258,599) (177,562)
Purchase of prepaid lease payments (69,903) –
Sale of property, plant and equipment 9,181 9,106
Acquisition of businesses, net of cash acquired (2,325,726) –
Interests acquired in associates and a joint venture (7,911) (8,769)
Payment for construction-in-progress (347,506) (388,238)
Payment for intangible assets (296,689) (109,544)
Purchase of available-for-sale financial assets (32,596) (8,550)
Net proceeds from disposal of an available-for-sale financial asset –41,348
Decrease in bank deposits 16,645 24,070
Dividends received 305 547
Interest received 30,902 33,893
Net cash used in investing activities (3,281,897) (583,699)
Cash flows from financing activities
Exercise of share options 385 5,946
Repurchase of shares –(45,304)
Contribution to employee share trusts (129,365) (100,688)
Dividends paid (326,930) (266,692)
Proceeds from borrowings 1,803,420 119,292
Repayments of borrowings (693,880) (142,661)
Issue of long term notes 1,488,980 –
Net cash generated from/(used in) financing activities 2,142,610 (430,107)
(Decrease)/increase in cash and cash equivalents (900,795) 418,252
Effect of foreign exchange rate changes (102,126) (14,190)
Cash and cash equivalents at the beginning of the year 3,858,144 3,454,082
Cash and cash equivalents at the end of the year 24 2,855,223 3,858,144