Lenovo 2015 Annual Report Download - page 172
Download and view the complete annual report
Please find page 172 of the 2015 Lenovo annual report below. You can navigate through the pages in the report by either clicking on the pages listed below, or by using the keyword search tool below to find specific information within the annual report.-
 1
1 -
2
-
3
-
4
-
5
-
6
-
7
-
8
-
9
-
10
-
11
-
12
-
13
-
14
-
15
-
16
-
17
-
18
-
19
-
20
-
21
-
22
-
23
-
24
-
25
-
26
-
27
-
28
-
29
-
30
-
31
-
32
-
33
-
34
-
35
-
36
-
37
-
38
-
39
-
40
-
41
-
42
-
43
-
44
-
45
-
46
-
47
-
48
-
49
-
50
-
51
-
52
-
53
-
54
-
55
-
56
-
57
-
58
-
59
-
60
-
61
-
62
-
63
-
64
-
65
-
66
-
67
-
68
-
69
-
70
-
71
-
72
-
73
-
74
-
75
-
76
-
77
-
78
-
79
-
80
-
81
-
82
-
83
-
84
-
85
-
86
-
87
-
88
-
89
-
90
-
91
-
92
-
93
-
94
-
95
-
96
-
97
-
98
-
99
-
100
-
101
-
102
-
103
-
104
-
105
-
106
-
107
-
108
-
109
-
110
-
111
-
112
-
113
-
114
-
115
-
116
-
117
-
118
-
119
-
120
-
121
-
122
-
123
-
124
-
125
-
126
-
127
-
128
-
129
-
130
-
131
-
132
-
133
-
134
-
135
-
136
-
137
-
138
-
139
-
140
-
141
-
142
-
143
-
144
-
145
-
146
-
147
-
148
-
149
-
150
-
151
-
152
-
153
-
154
-
155
-
156
-
157
-
158
-
159
-
160
-
161
-
 162
162 -
 163
163 -
 164
164 -
 165
165 -
 166
166 -
 167
167 -
 168
168 -
 169
169 -
 170
170 -
 171
171 -
 172
172 -
 173
173 -
 174
174 -
 175
175 -
 176
176 -
 177
177 -
 178
178 -
 179
179 -
 180
180 -
 181
181 -
 182
182 -
183
-
184
-
185
-
186
-
187
-
188
-
189
-
190
-
191
-
192
-
193
-
194
-
195
-
196
-
197
-
198
-
199
-
200
-
201
-
202
-
203
-
204
-
205
-
206
-
207
-
208
-
209
-
210
-
211
-
212
-
213
-
214
-
215
 |
 |

170 Lenovo Group Limited 2014/15 Annual Report
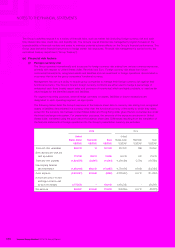
NOTES TO THE FINANCIAL STATEMENTS
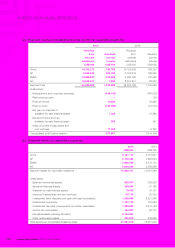
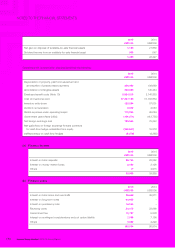
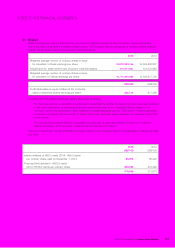
6 OTHER INCOME – NET
2015 2014
US$’000 US$’000
Net gain on disposal of available-for-sale financial assets 1,185 21,880
Dividend income from an available-for-sale financial asset 305 547
1,490 22,427
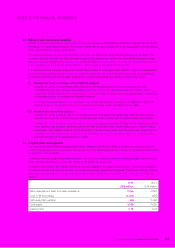
7 OPERATING PROFIT
Operating profit is stated after charging/(crediting) the following:
2015 2014
US$’000 US$’000
Depreciation of property, plant and equipment and
amortization of prepaid lease payments 208,363 109,689
Amortization of intangible assets 300,380 145,444
Employee benefit costs (Note 10) 3,524,219 2,745,853
Cost of inventories sold 37,067,180 31,763,864
Inventory write-down 125,284 57,031
Auditor’s remuneration 9,002 4,543
Rental expenses under operating leases 113,264 99,024
Government grant (Note 28(iv)) (154,571) (143,755)
Net foreign exchange loss 189,550 79,242
Net (gain)/loss on foreign exchange forward contracts
for cash flow hedge reclassified from equity (299,847) 10,818
Ineffectiveness on cash flow hedges (9,279) (4,265)
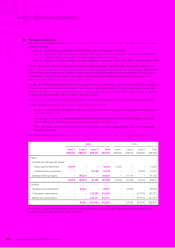
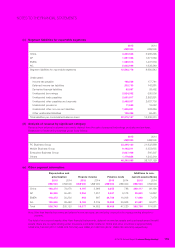
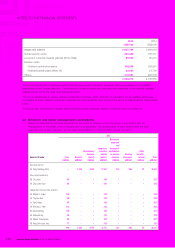
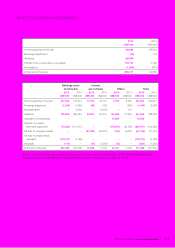
8 FINANCE INCOME AND COSTS
(a) Finance income
2015 2014
US$’000 US$’000
Interest on bank deposits 28,793 26,852
Interest on money market funds 2,092 2,126
Others 17 4,915
30,902 33,893
(b) Finance costs
2015 2014
US$’000 US$’000
Interest on bank loans and overdrafts 28,658 39,811
Interest on long term notes 64,925 –
Interest on promissory note 16,599 –
Factoring costs 54,075 23,866
Commitment fee 10,787 5,878
Interest on contingent considerations and put option liability 7,068 7,190
Others 3,392 4,229
185,504 80,974