Lenovo 2015 Annual Report Download - page 165
Download and view the complete annual report
Please find page 165 of the 2015 Lenovo annual report below. You can navigate through the pages in the report by either clicking on the pages listed below, or by using the keyword search tool below to find specific information within the annual report.-
 1
1 -
2
-
3
-
4
-
5
-
6
-
7
-
8
-
9
-
10
-
11
-
12
-
13
-
14
-
15
-
16
-
17
-
18
-
19
-
20
-
21
-
22
-
23
-
24
-
25
-
26
-
27
-
28
-
29
-
30
-
31
-
32
-
33
-
34
-
35
-
36
-
37
-
38
-
39
-
40
-
41
-
42
-
43
-
44
-
45
-
46
-
47
-
48
-
49
-
50
-
51
-
52
-
53
-
54
-
55
-
56
-
57
-
58
-
59
-
60
-
61
-
62
-
63
-
64
-
65
-
66
-
67
-
68
-
69
-
70
-
71
-
72
-
73
-
74
-
75
-
76
-
77
-
78
-
79
-
80
-
81
-
82
-
83
-
84
-
85
-
86
-
87
-
88
-
89
-
90
-
91
-
92
-
93
-
94
-
95
-
96
-
97
-
98
-
99
-
100
-
101
-
102
-
103
-
104
-
105
-
106
-
107
-
108
-
109
-
110
-
111
-
112
-
113
-
114
-
115
-
116
-
117
-
118
-
119
-
120
-
121
-
122
-
123
-
124
-
125
-
126
-
127
-
128
-
129
-
130
-
131
-
132
-
133
-
134
-
135
-
136
-
137
-
138
-
139
-
140
-
141
-
142
-
143
-
144
-
145
-
146
-
147
-
148
-
149
-
150
-
151
-
152
-
153
-
154
-
 155
155 -
 156
156 -
 157
157 -
 158
158 -
 159
159 -
 160
160 -
 161
161 -
 162
162 -
 163
163 -
 164
164 -
 165
165 -
 166
166 -
 167
167 -
 168
168 -
 169
169 -
 170
170 -
 171
171 -
 172
172 -
 173
173 -
 174
174 -
 175
175 -
176
-
177
-
178
-
179
-
180
-
181
-
182
-
183
-
184
-
185
-
186
-
187
-
188
-
189
-
190
-
191
-
192
-
193
-
194
-
195
-
196
-
197
-
198
-
199
-
200
-
201
-
202
-
203
-
204
-
205
-
206
-
207
-
208
-
209
-
210
-
211
-
212
-
213
-
214
-
215
 |
 |

163
2014/15 Annual Report Lenovo Group Limited
NOTES TO THE FINANCIAL STATEMENTS
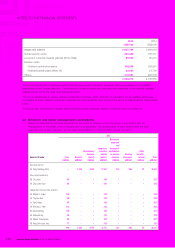
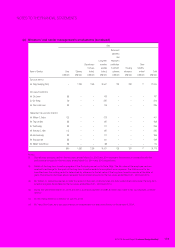
3 FINANCIAL RISK MANAGEMENT (continued)
(b) Market risks sensitivity analysis
HKFRS 7 “Financial instruments: Disclosures” requires the disclosure of a sensitivity analysis for market risks that show
the effects of a hypothetical change in the relevant market risk variable to which the Group is exposed to at the balance
sheet date on profit or loss and total equity.
The sensitivity analysis for each type of market risks does not reflect inter-dependencies between risk variables. The
sensitivity analysis assumes that a hypothetical change of the relevant risk variable had occurred at the balance sheet
date and had been applied to the relevant risk variable in existence on that date. The bases and assumptions adopted
in the preparation of the analyses will by definition, seldom equal to the related actual results.
The disclosure of the sensitivity analysis on market risks is solely for compliance with HKFRS 7 disclosure requirements
in respect of financial instruments, and are for illustration purposes only; and it should be noted that the hypothetical
amounts so generated do not represent a projection of likely future events and profits or losses of the Group.
(i) Foreign currency exchange rate sensitivity analysis
At March 31, 2015, if United States dollar had weakened/strengthened by one percent against the major
currencies with all other variables held constant, post-tax profit for the year would have been US$2.7 million
higher/lower (2014: US$2.2 million higher/lower), mainly as a result of foreign exchange gains/losses on translation
of unhedged portion of receivable and payable balances.
The analysis above is based on the assumption that United States dollar weakened or strengthened against all
other currencies in the same direction and magnitude, but it may not be necessarily true in reality.
(ii) Interest rate sensitivity analysis
At March 31, 2015, if interest rate on borrowings had been 25 basis points higher/lower with all other variables
held constant, post-tax profit for the year would have been US$1.5 million (2014: US$0.9 million) lower/higher.
At March 31, 2015, if interest rates on customer financing programs had been 25 basis points higher/lower with all
other variables held constant, post-tax profit for the year would have been US$2.8 million (2014: US$2.2 million)
lower/higher. This analysis is based on the assumption that the interest rates of all the currencies covered by the
customer financing programs go up and down at the same time and with the same magnitude; however, such
assumptions may not be necessarily true in reality.
(c) Capital risks management
The Group’s objectives when managing capital are to safeguard the Group’s ability to continue as a going concern in
order to provide returns for shareholders and benefits for other stakeholders and to maintain an optimal capital structure
to reduce the cost of capital.
In order to maintain or adjust the capital structure, the Group may adjust the amount of dividends paid to shareholders,
return capital to shareholders, issue new shares or sell assets to reduce debt.
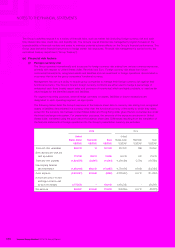
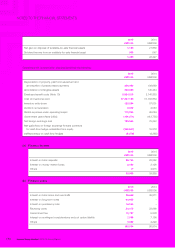
Consistent with others in the industry, the Group monitors capital on the basis of gearing ratio. This ratio is calculated
as total borrowings (including current and non-current borrowings) divided by total equity. The Group’s strategy remains
unchanged and the gearing ratios and net (debt)/cash position of the Group as at March 31, 2015 and 2014 are as
follows:
2015 2014
US$ million US$ million
Bank deposits and cash and cash equivalents 3,026 3,953
Less: total borrowings (3,054) (455)
Net (debt)/cash position (28) 3,498
Total equity 4,106 3,025
Gearing ratio 0.74 0.15