Lenovo 2015 Annual Report Download - page 181
Download and view the complete annual report
Please find page 181 of the 2015 Lenovo annual report below. You can navigate through the pages in the report by either clicking on the pages listed below, or by using the keyword search tool below to find specific information within the annual report.-
 1
1 -
2
-
3
-
4
-
5
-
6
-
7
-
8
-
9
-
10
-
11
-
12
-
13
-
14
-
15
-
16
-
17
-
18
-
19
-
20
-
21
-
22
-
23
-
24
-
25
-
26
-
27
-
28
-
29
-
30
-
31
-
32
-
33
-
34
-
35
-
36
-
37
-
38
-
39
-
40
-
41
-
42
-
43
-
44
-
45
-
46
-
47
-
48
-
49
-
50
-
51
-
52
-
53
-
54
-
55
-
56
-
57
-
58
-
59
-
60
-
61
-
62
-
63
-
64
-
65
-
66
-
67
-
68
-
69
-
70
-
71
-
72
-
73
-
74
-
75
-
76
-
77
-
78
-
79
-
80
-
81
-
82
-
83
-
84
-
85
-
86
-
87
-
88
-
89
-
90
-
91
-
92
-
93
-
94
-
95
-
96
-
97
-
98
-
99
-
100
-
101
-
102
-
103
-
104
-
105
-
106
-
107
-
108
-
109
-
110
-
111
-
112
-
113
-
114
-
115
-
116
-
117
-
118
-
119
-
120
-
121
-
122
-
123
-
124
-
125
-
126
-
127
-
128
-
129
-
130
-
131
-
132
-
133
-
134
-
135
-
136
-
137
-
138
-
139
-
140
-
141
-
142
-
143
-
144
-
145
-
146
-
147
-
148
-
149
-
150
-
151
-
152
-
153
-
154
-
155
-
156
-
157
-
158
-
159
-
160
-
161
-
162
-
163
-
164
-
165
-
166
-
167
-
168
-
169
-
170
-
 171
171 -
 172
172 -
 173
173 -
 174
174 -
 175
175 -
 176
176 -
 177
177 -
 178
178 -
 179
179 -
 180
180 -
 181
181 -
 182
182 -
 183
183 -
 184
184 -
 185
185 -
 186
186 -
 187
187 -
 188
188 -
 189
189 -
 190
190 -
 191
191 -
192
-
193
-
194
-
195
-
196
-
197
-
198
-
199
-
200
-
201
-
202
-
203
-
204
-
205
-
206
-
207
-
208
-
209
-
210
-
211
-
212
-
213
-
214
-
215
 |
 |

179
2014/15 Annual Report Lenovo Group Limited
NOTES TO THE FINANCIAL STATEMENTS
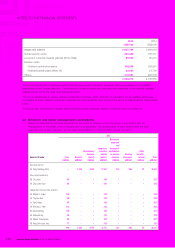
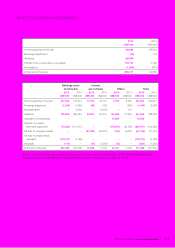
17 INTANGIBLE ASSETS (continued)
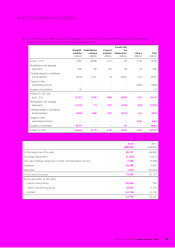
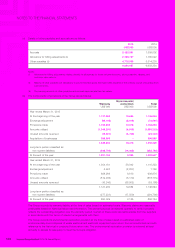
(b) Impairment tests for goodwill and intangible assets with indefinite useful lives
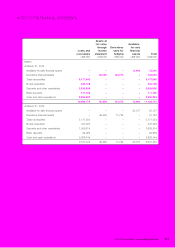
The carrying amounts of goodwill and trademarks and trade names with indefinite useful lives are presented below:
China AP EMEA AG
Amounts
pending
allocation Total
US$ million US$ million US$ million US$ million US$ million US$ million
At March 31, 2015
Goodwill 1,128 521 216 336 2,723 4,924
Trademarks and trade names 209 59 102 67 830 1,267
China AP EMEA AG Total
US$ million US$ million US$ million US$ million US$ million
At March 31, 2014
Goodwill
1,123 597 287 383 2,390
Trademarks and trade names
209 59 118 67 453
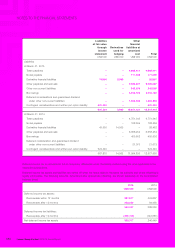
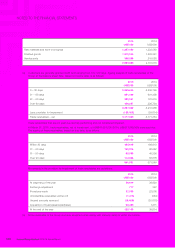
Goodwill pending allocation represents the amount attributable to the acquisition of Motorola Mobility Group (“Motorola”)
and X86 server hardware and related maintenance services business of IBM (“System X”), details of which are set out
in Note 36. The goodwill is primarily attributable to the significant synergies expected to arise in connection with the
development of mobile devices and X86 server businesses, respectively. Management is in the process of determining
the allocation of goodwill and other intangible assets to the appropriate cash generating units of the Group.
The Group completed its annual impairment test for goodwill allocated to the Group’s various CGUs by comparing their
recoverable amounts to their carrying amounts as at the reporting date. The recoverable amount of a CGU is determined
based on value in use. These assessments use pre-tax cash flow projections based on financial budgets approved by
management covering a five-year period with a terminal value related to the future cash flow of the CGU extrapolated
using constant projection of cash flows beyond the five-year period. The estimated growth rates adopted do not exceed
the long-term average growth rates for the businesses in which the CGU operates.
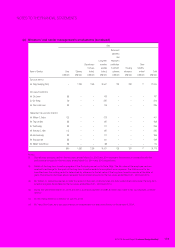
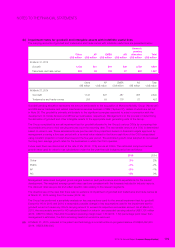
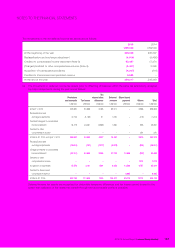
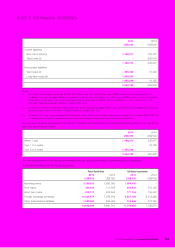
Future cash flows are discounted at the rate of 9% (2014: 11%) across all CGUs. The estimated compound annual
growth rates used for value-in-use calculations under the five-year financial budgets period are as follows:
2015 2014
China 2% 2%
EMEA -2% -2%
AP -2% -1%
AG -2% 0%
Management determined budgeted gross margins based on past performance and its expectations for the market
development. The weighted average growth rates used are consistent with the forecasts included in industry reports.
The discount rates are pre-tax and reflect specific risks relating to the relevant segments.
The directors are of the view that there was no evidence of impairment of goodwill and trademarks and trade names as
at March 31, 2015 arising from the review (2014: nil).
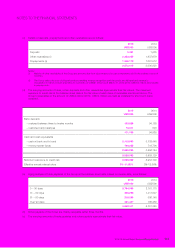
The Group has performed a sensitivity analysis on key assumptions used for the annual impairment test for goodwill.
Except for AG in 2015 and 2014, a reasonably possible change in key assumptions used in the impairment test for
goodwill would not cause any CGU’s carrying amount to exceed its respective recoverable amount. As at March 31,
2015, the recoverable amount for AG calculated based on value in use exceeded carrying value by US$1,101 million
(2014: US$774 million). Had AG’s forecasted operating margin been 1.50 (2014: 1.30) percentage point lower than
management’s estimates, the AG’s remaining headroom would be removed.
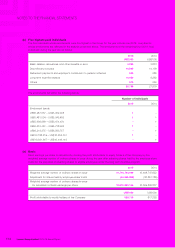
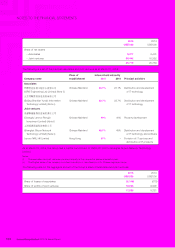
(c) At March 31, 2015, included in the patent and technology is a construction-in-progress balance of US$24,452,000
(2014: US$58,880,000).