Lenovo 2015 Annual Report Download - page 205
Download and view the complete annual report
Please find page 205 of the 2015 Lenovo annual report below. You can navigate through the pages in the report by either clicking on the pages listed below, or by using the keyword search tool below to find specific information within the annual report.-
 1
1 -
2
-
3
-
4
-
5
-
6
-
7
-
8
-
9
-
10
-
11
-
12
-
13
-
14
-
15
-
16
-
17
-
18
-
19
-
20
-
21
-
22
-
23
-
24
-
25
-
26
-
27
-
28
-
29
-
30
-
31
-
32
-
33
-
34
-
35
-
36
-
37
-
38
-
39
-
40
-
41
-
42
-
43
-
44
-
45
-
46
-
47
-
48
-
49
-
50
-
51
-
52
-
53
-
54
-
55
-
56
-
57
-
58
-
59
-
60
-
61
-
62
-
63
-
64
-
65
-
66
-
67
-
68
-
69
-
70
-
71
-
72
-
73
-
74
-
75
-
76
-
77
-
78
-
79
-
80
-
81
-
82
-
83
-
84
-
85
-
86
-
87
-
88
-
89
-
90
-
91
-
92
-
93
-
94
-
95
-
96
-
97
-
98
-
99
-
100
-
101
-
102
-
103
-
104
-
105
-
106
-
107
-
108
-
109
-
110
-
111
-
112
-
113
-
114
-
115
-
116
-
117
-
118
-
119
-
120
-
121
-
122
-
123
-
124
-
125
-
126
-
127
-
128
-
129
-
130
-
131
-
132
-
133
-
134
-
135
-
136
-
137
-
138
-
139
-
140
-
141
-
142
-
143
-
144
-
145
-
146
-
147
-
148
-
149
-
150
-
151
-
152
-
153
-
154
-
155
-
156
-
157
-
158
-
159
-
160
-
161
-
162
-
163
-
164
-
165
-
166
-
167
-
168
-
169
-
170
-
171
-
172
-
173
-
174
-
175
-
176
-
177
-
178
-
179
-
180
-
181
-
182
-
183
-
184
-
185
-
186
-
187
-
188
-
189
-
190
-
191
-
192
-
193
-
194
-
 195
195 -
 196
196 -
 197
197 -
 198
198 -
 199
199 -
 200
200 -
 201
201 -
 202
202 -
 203
203 -
 204
204 -
 205
205 -
 206
206 -
 207
207 -
 208
208 -
 209
209 -
 210
210 -
 211
211 -
 212
212 -
 213
213 -
 214
214 -
 215
215
 |
 |

203
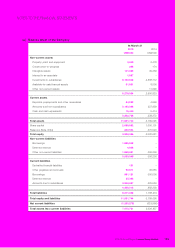
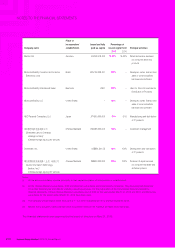
2014/15 Annual Report Lenovo Group Limited
NOTES TO THE FINANCIAL STATEMENTS
35 RETIREMENT BENEFIT OBLIGATIONS (continued)
(c) Additional information on post-employment benefits (pension and medical) (continued)
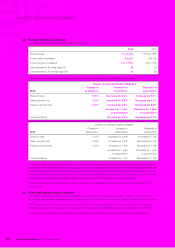
Reconciliation of movements in present value of defined benefit obligations of the Group:
Pension Medical
2015 2014 2015 2014
US$’000 US$’000 US$’000 US$’000
Opening defined benefit obligation 409,357 424,641 19,578 20,542
Exchange adjustment (50,501) (16,002) (178) (169)
Current service cost 14,272 15,850 455 495
Past service cost (1,542) (695) –(34)
Interest cost 10,845 9,689 676 685
Remeasurements:
Loss from change in
demographic assumptions 6,617 509 (104) 69
Loss/(gain) from changes in
financial assumptions 90,530 (4,614) 310 (678)
Experience loss/(gain) 2,330 1,779 (526) (465)
Contributions by plan participants 408 415 ––
Benefits paid (16,393) (25,135) (258) (373)
Curtailments 5,205 2,920 (1,859) (494)
Acquisition of businesses 190,329 –9,793 –
Closing defined benefit obligation 661,457 409,357 27,887 19,578
During the year, benefits of US$716,000 were paid directly by the Group (2014: US$2,061,000).
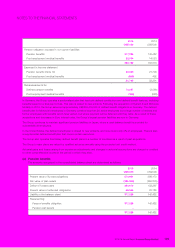
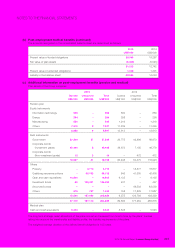
Summary of pensions and post-retirement medical benefits of the Group:
2015 2014 2013 2012 2011
US$’000 US$’000 US$’000 US$’000 US$’000
Present value of defined
benefit obligations 689,344 428,935 445,183 435,760 255,673
Fair value of plan assets 289,562 272,420 281,300 230,942 180,803
Deficit 399,782 156,515 163,883 204,818 74,870
Actuarial (gains)/losses
arising on plan assets (29,070) (588) (7,840) 1,786 3,642
Actuarial losses/(gains)
arising on plan liabilities 99,157 (3,400) 25,014 35,751 3,548
70,087 (3,988) 17,174 37,537 7,190