Lenovo 2015 Annual Report Download - page 200
Download and view the complete annual report
Please find page 200 of the 2015 Lenovo annual report below. You can navigate through the pages in the report by either clicking on the pages listed below, or by using the keyword search tool below to find specific information within the annual report.-
 1
1 -
2
-
3
-
4
-
5
-
6
-
7
-
8
-
9
-
10
-
11
-
12
-
13
-
14
-
15
-
16
-
17
-
18
-
19
-
20
-
21
-
22
-
23
-
24
-
25
-
26
-
27
-
28
-
29
-
30
-
31
-
32
-
33
-
34
-
35
-
36
-
37
-
38
-
39
-
40
-
41
-
42
-
43
-
44
-
45
-
46
-
47
-
48
-
49
-
50
-
51
-
52
-
53
-
54
-
55
-
56
-
57
-
58
-
59
-
60
-
61
-
62
-
63
-
64
-
65
-
66
-
67
-
68
-
69
-
70
-
71
-
72
-
73
-
74
-
75
-
76
-
77
-
78
-
79
-
80
-
81
-
82
-
83
-
84
-
85
-
86
-
87
-
88
-
89
-
90
-
91
-
92
-
93
-
94
-
95
-
96
-
97
-
98
-
99
-
100
-
101
-
102
-
103
-
104
-
105
-
106
-
107
-
108
-
109
-
110
-
111
-
112
-
113
-
114
-
115
-
116
-
117
-
118
-
119
-
120
-
121
-
122
-
123
-
124
-
125
-
126
-
127
-
128
-
129
-
130
-
131
-
132
-
133
-
134
-
135
-
136
-
137
-
138
-
139
-
140
-
141
-
142
-
143
-
144
-
145
-
146
-
147
-
148
-
149
-
150
-
151
-
152
-
153
-
154
-
155
-
156
-
157
-
158
-
159
-
160
-
161
-
162
-
163
-
164
-
165
-
166
-
167
-
168
-
169
-
170
-
171
-
172
-
173
-
174
-
175
-
176
-
177
-
178
-
179
-
180
-
181
-
182
-
183
-
184
-
185
-
186
-
187
-
188
-
189
-
 190
190 -
 191
191 -
 192
192 -
 193
193 -
 194
194 -
 195
195 -
 196
196 -
 197
197 -
 198
198 -
 199
199 -
 200
200 -
 201
201 -
 202
202 -
 203
203 -
 204
204 -
 205
205 -
 206
206 -
 207
207 -
 208
208 -
 209
209 -
 210
210 -
211
-
212
-
213
-
214
-
215
 |
 |

198 Lenovo Group Limited 2014/15 Annual Report
NOTES TO THE FINANCIAL STATEMENTS
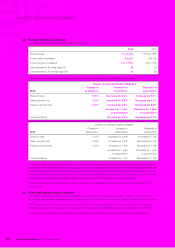
33 CONTINGENT LIABILITIES
The Group, in the ordinary course of its business, is involved in various claims, suits, investigations, and legal proceedings
that arise from time to time. Although the Group does not expect that the outcome in any of these legal proceedings,
individually or collectively, will have a material adverse effect on its financial position or results of operations, litigation is
inherently unpredictable. Therefore, the Group could incur judgments or enter into settlements of claims that could adversely
affect its operating results or cash flows in a particular period.
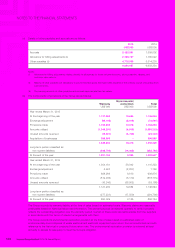
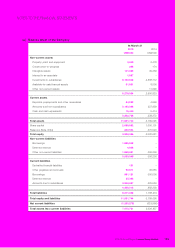
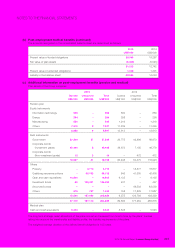
34 RECONCILIATION OF PROFIT BEFORE TAXATION TO NET CASH GENERATED
FROM OPERATIONS
2015 2014
US$’000 US$’000
Profit before taxation 970,967 1,014,195
Share of profits of associates and joint ventures (17,055) (9,221)
Finance income (30,902) (33,893)
Finance costs 185,504 80,974
Depreciation of property, plant and equipment and
amortization of prepaid lease payments 208,363 109,689
Amortization of intangible assets and share-based compensation 399,442 225,718
Loss/(gain) on disposal of property, plant and equipment 162 (356)
Net gain on disposal of available-for-sale financial assets (1,185) (21,880)
Loss on disposal of construction-in-progress 200 1,219
Loss on disposal of intangible assets 2,656 12,673
Dividend income (305) (547)
Fair value change on financial instruments 20,376 (10,572)
Release of escrow shares for settlement of acquisition consideration –(6,913)
Decrease/(increase) in inventories 120,263 (739,964)
(Increase)/decrease in trade receivables, notes receivable,
deposits, prepayments and other receivables (526,439) 1,474
(Decrease)/increase in trade payables, notes payable,
provisions, other payables and accruals (491,457) 1,011,546
Effect of foreign exchange rate changes (171,570) 6,244
Net cash generated from operations 669,020 1,640,386