Lenovo 2015 Annual Report Download - page 166
Download and view the complete annual report
Please find page 166 of the 2015 Lenovo annual report below. You can navigate through the pages in the report by either clicking on the pages listed below, or by using the keyword search tool below to find specific information within the annual report.-
 1
1 -
2
-
3
-
4
-
5
-
6
-
7
-
8
-
9
-
10
-
11
-
12
-
13
-
14
-
15
-
16
-
17
-
18
-
19
-
20
-
21
-
22
-
23
-
24
-
25
-
26
-
27
-
28
-
29
-
30
-
31
-
32
-
33
-
34
-
35
-
36
-
37
-
38
-
39
-
40
-
41
-
42
-
43
-
44
-
45
-
46
-
47
-
48
-
49
-
50
-
51
-
52
-
53
-
54
-
55
-
56
-
57
-
58
-
59
-
60
-
61
-
62
-
63
-
64
-
65
-
66
-
67
-
68
-
69
-
70
-
71
-
72
-
73
-
74
-
75
-
76
-
77
-
78
-
79
-
80
-
81
-
82
-
83
-
84
-
85
-
86
-
87
-
88
-
89
-
90
-
91
-
92
-
93
-
94
-
95
-
96
-
97
-
98
-
99
-
100
-
101
-
102
-
103
-
104
-
105
-
106
-
107
-
108
-
109
-
110
-
111
-
112
-
113
-
114
-
115
-
116
-
117
-
118
-
119
-
120
-
121
-
122
-
123
-
124
-
125
-
126
-
127
-
128
-
129
-
130
-
131
-
132
-
133
-
134
-
135
-
136
-
137
-
138
-
139
-
140
-
141
-
142
-
143
-
144
-
145
-
146
-
147
-
148
-
149
-
150
-
151
-
152
-
153
-
154
-
155
-
 156
156 -
 157
157 -
 158
158 -
 159
159 -
 160
160 -
 161
161 -
 162
162 -
 163
163 -
 164
164 -
 165
165 -
 166
166 -
 167
167 -
 168
168 -
 169
169 -
 170
170 -
 171
171 -
 172
172 -
 173
173 -
 174
174 -
 175
175 -
 176
176 -
177
-
178
-
179
-
180
-
181
-
182
-
183
-
184
-
185
-
186
-
187
-
188
-
189
-
190
-
191
-
192
-
193
-
194
-
195
-
196
-
197
-
198
-
199
-
200
-
201
-
202
-
203
-
204
-
205
-
206
-
207
-
208
-
209
-
210
-
211
-
212
-
213
-
214
-
215
 |
 |

164 Lenovo Group Limited 2014/15 Annual Report
NOTES TO THE FINANCIAL STATEMENTS
3 FINANCIAL RISK MANAGEMENT (continued)
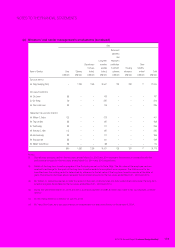
(d) Fair value estimation
The table below analyzes financial instruments carried at fair value, by valuation method. The different levels have been
defined as follows:
–Level 1 Quoted prices (unadjusted) in active markets for identical assets or liabilities
–Level 2 Inputs other than quoted prices included within level 1 that are observable for the asset or liability, either
directly (that is, as prices) or indirectly (that is, derived from prices)
–Level 3 Inputs for the asset or liability that are not based on observable market data (that is, unobservable inputs)
The fair value of financial instruments traded in active markets is based on quoted market prices at the balance sheet
date. A market is regarded as active if quoted prices are readily and regularly available from an exchange, dealer, broker,
industry group, pricing service, or regulatory agency, and those prices represent actual and regularly occurring market
transactions on an arm’s length basis. The quoted market price used for financial assets held by the Group is the
current bid price. These instruments are included in Level 1.
The fair value of financial instruments that are not traded in an active market (for example, over-the-counter derivatives)
is determined by using valuation techniques. These valuation techniques maximize the use of observable market data
where it is available and rely as little as possible on entity specific estimates. If all significant inputs required to fair value
an instrument are observable, the instrument is included in Level 2.
If one or more of the significant inputs is not based on observable market data, the instrument is included in Level 3.
Specific valuation techniques used to value financial instruments include:
– The fair value of interest rate swaps is calculated as the present value of the estimated future cash flows based on
observable yield curves.
– The fair value of forward foreign exchange contracts is determined using quoted forward exchange rates at the
balance sheet date, with the resulting value discounted back to present value.
– Other techniques, such as estimated discounted cash flows, are used to determine fair value for the remaining
financial instruments.
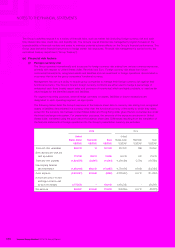
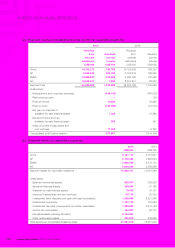
The following table presents the assets and liabilities that are measured at fair value at March 31, 2015 and 2014.
2015 2014
Level 1 Level 2 Level 3 Total Level 1 Level 2 Level 3 Total
US$’000 US$’000 US$’000 US$’000 US$’000 US$’000 US$’000 US$’000
Assets
Available-for-sale financial assets
Listed equity investments 39,292 – – 39,292 10,455 – – 10,455
Unlisted equity investments – – 34,108 34,108 – – 24,702 24,702
Derivative financial assets –184,534 –184,534 –61,184 –61,184
39,292 184,534 34,108 257,934 10,455 61,184 24,702 96,341
Liabilities
Derivative financial liabilities –80,897 –80,897 –58,462 –58,462
Contingent considerations – – 312,083 312,083 – – 307,183 307,183
Written put option liability – – 219,317 219,317 – – 217,157 217,157
–80,897 531,400 612,297 –58,462 524,340 582,802
There were no significant transfers of financial assets between Level 1 and Level 2 fair value hierarchy classification
during the years ended March 31, 2015 and 2014.