Lenovo 2015 Annual Report Download - page 213
Download and view the complete annual report
Please find page 213 of the 2015 Lenovo annual report below. You can navigate through the pages in the report by either clicking on the pages listed below, or by using the keyword search tool below to find specific information within the annual report.-
 1
1 -
2
-
3
-
4
-
5
-
6
-
7
-
8
-
9
-
10
-
11
-
12
-
13
-
14
-
15
-
16
-
17
-
18
-
19
-
20
-
21
-
22
-
23
-
24
-
25
-
26
-
27
-
28
-
29
-
30
-
31
-
32
-
33
-
34
-
35
-
36
-
37
-
38
-
39
-
40
-
41
-
42
-
43
-
44
-
45
-
46
-
47
-
48
-
49
-
50
-
51
-
52
-
53
-
54
-
55
-
56
-
57
-
58
-
59
-
60
-
61
-
62
-
63
-
64
-
65
-
66
-
67
-
68
-
69
-
70
-
71
-
72
-
73
-
74
-
75
-
76
-
77
-
78
-
79
-
80
-
81
-
82
-
83
-
84
-
85
-
86
-
87
-
88
-
89
-
90
-
91
-
92
-
93
-
94
-
95
-
96
-
97
-
98
-
99
-
100
-
101
-
102
-
103
-
104
-
105
-
106
-
107
-
108
-
109
-
110
-
111
-
112
-
113
-
114
-
115
-
116
-
117
-
118
-
119
-
120
-
121
-
122
-
123
-
124
-
125
-
126
-
127
-
128
-
129
-
130
-
131
-
132
-
133
-
134
-
135
-
136
-
137
-
138
-
139
-
140
-
141
-
142
-
143
-
144
-
145
-
146
-
147
-
148
-
149
-
150
-
151
-
152
-
153
-
154
-
155
-
156
-
157
-
158
-
159
-
160
-
161
-
162
-
163
-
164
-
165
-
166
-
167
-
168
-
169
-
170
-
171
-
172
-
173
-
174
-
175
-
176
-
177
-
178
-
179
-
180
-
181
-
182
-
183
-
184
-
185
-
186
-
187
-
188
-
189
-
190
-
191
-
192
-
193
-
194
-
195
-
196
-
197
-
198
-
199
-
200
-
201
-
202
-
 203
203 -
 204
204 -
 205
205 -
 206
206 -
 207
207 -
 208
208 -
 209
209 -
 210
210 -
 211
211 -
 212
212 -
 213
213 -
 214
214 -
 215
215
 |
 |

211
2014/15 Annual Report Lenovo Group Limited
FIVE-YEAR FINANCIAL SUMMARY
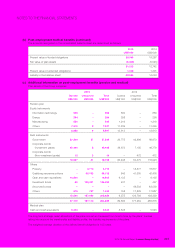
CONDENSED CONSOLIDATED INCOME STATEMENT
2015 2014 2013 2012 2011
US$’000 US$’000 US$’000 US$’000 US$’000
Revenue 46,295,593 38,707,129 33,873,401 29,574,438 21,594,371
Profit before taxation 970,967 1,014,195 801,299 582,443 357,751
Taxation (134,364) (196,725) (169,707) (107,027) (84,515)
Profit for the year 836,603 817,470 631,592 475,416 273,236
Profit/(loss) attributable to:
Equity holders of the Company 828,715 817,228 635,148 472,992 273,234
Non-controlling interests 7,888 242 (3,556) 2,424 2
836,603 817,470 631,592 475,416 273,236
Earnings per share attributable to
equity holders of the Company
Basic (US cents) 7.77 7.88 6.16 4.67 2.84
Diluted (US cents) 7.69 7.78 6.07 4.57 2.73
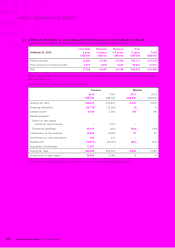
CONDENSED CONSOLIDATED BALANCE SHEET
2015 2014 2013 2012 2011
US$’000 US$’000 US$’000 US$’000 US$’000
Non-current assets 11,653,543 4,956,545 4,492,260 4,040,348 2,769,476
Current assets 15,427,735 13,400,548 12,389,737 11,820,400 7,936,463
Total assets 27,081,278 18,357,093 16,881,997 15,860,748 10,705,939
Non-current liabilities 5,813,795 1,870,051 2,110,342 1,603,102 838,386
Current liabilities 17,161,362 13,462,322 12,091,474 11,809,677 8,032,653
Total liabilities 22,975,157 15,332,373 14,201,816 13,412,779 8,871,039
Net assets 4,106,121 3,024,720 2,680,181 2,447,969 1,834,900