Lenovo 2015 Annual Report Download - page 197
Download and view the complete annual report
Please find page 197 of the 2015 Lenovo annual report below. You can navigate through the pages in the report by either clicking on the pages listed below, or by using the keyword search tool below to find specific information within the annual report.-
 1
1 -
2
-
3
-
4
-
5
-
6
-
7
-
8
-
9
-
10
-
11
-
12
-
13
-
14
-
15
-
16
-
17
-
18
-
19
-
20
-
21
-
22
-
23
-
24
-
25
-
26
-
27
-
28
-
29
-
30
-
31
-
32
-
33
-
34
-
35
-
36
-
37
-
38
-
39
-
40
-
41
-
42
-
43
-
44
-
45
-
46
-
47
-
48
-
49
-
50
-
51
-
52
-
53
-
54
-
55
-
56
-
57
-
58
-
59
-
60
-
61
-
62
-
63
-
64
-
65
-
66
-
67
-
68
-
69
-
70
-
71
-
72
-
73
-
74
-
75
-
76
-
77
-
78
-
79
-
80
-
81
-
82
-
83
-
84
-
85
-
86
-
87
-
88
-
89
-
90
-
91
-
92
-
93
-
94
-
95
-
96
-
97
-
98
-
99
-
100
-
101
-
102
-
103
-
104
-
105
-
106
-
107
-
108
-
109
-
110
-
111
-
112
-
113
-
114
-
115
-
116
-
117
-
118
-
119
-
120
-
121
-
122
-
123
-
124
-
125
-
126
-
127
-
128
-
129
-
130
-
131
-
132
-
133
-
134
-
135
-
136
-
137
-
138
-
139
-
140
-
141
-
142
-
143
-
144
-
145
-
146
-
147
-
148
-
149
-
150
-
151
-
152
-
153
-
154
-
155
-
156
-
157
-
158
-
159
-
160
-
161
-
162
-
163
-
164
-
165
-
166
-
167
-
168
-
169
-
170
-
171
-
172
-
173
-
174
-
175
-
176
-
177
-
178
-
179
-
180
-
181
-
182
-
183
-
184
-
185
-
186
-
 187
187 -
 188
188 -
 189
189 -
 190
190 -
 191
191 -
 192
192 -
 193
193 -
 194
194 -
 195
195 -
 196
196 -
 197
197 -
 198
198 -
 199
199 -
 200
200 -
 201
201 -
 202
202 -
 203
203 -
 204
204 -
 205
205 -
 206
206 -
 207
207 -
208
-
209
-
210
-
211
-
212
-
213
-
214
-
215
 |
 |

195
2014/15 Annual Report Lenovo Group Limited
NOTES TO THE FINANCIAL STATEMENTS
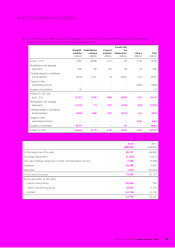
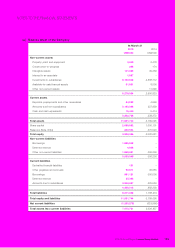
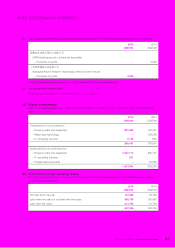
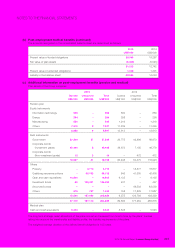
30 BALANCE SHEET AND MOVEMENT OF RESERVES OF THE COMPANY
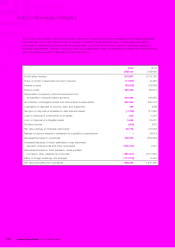
(a) Balance sheet of the Company
At March 31
2015
US$’000
2014
US$’000
Non-current assets
Property, plant and equipment 3,049 2,478
Construction-in-progress 296 174
Intangible assets 141,325 39,269
Interest in an associate 1,887 –
Investments in subsidiaries 8,100,648 2,888,712
Available-for-sale financial assets 31,801 8,500
Other non-current assets –11,690
8,279,006 2,950,823
Current assets
Deposits, prepayments and other receivables 54,252 4,999
Amounts due from subsidiaries 3,183,046 227,859
Cash and cash equivalents 15,440 5,414
3,252,738 238,272
Total assets 11,531,744 3,189,095
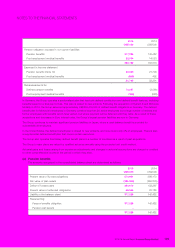
Share capital 2,689,882 1,650,101
Reserves (Note 30(b)) 830,504 370,520
Total equity 3,520,386 2,020,621
Non-current liabilities
Borrowings 1,885,848 –
Deferred revenue 4,806 –
Other non-current liabilities 1,662,691 306,236
3,553,345 306,236
Current liabilities
Derivative financial liabilities 131 –
Other payables and accruals 90,671 36,685
Borrowings 991,121 300,000
Deferred revenue 35,393 –
Amounts due to subsidiaries 3,340,697 525,553
4,458,013 862,238
Total liabilities 8,011,358 1,168,474
Total equity and liabilities 11,531,744 3,189,095
Net current liabilities (1,205,275) (623,966)
Total assets less current liabilities 7,073,731 2,326,857