Lenovo 2015 Annual Report Download - page 176
Download and view the complete annual report
Please find page 176 of the 2015 Lenovo annual report below. You can navigate through the pages in the report by either clicking on the pages listed below, or by using the keyword search tool below to find specific information within the annual report.-
 1
1 -
2
-
3
-
4
-
5
-
6
-
7
-
8
-
9
-
10
-
11
-
12
-
13
-
14
-
15
-
16
-
17
-
18
-
19
-
20
-
21
-
22
-
23
-
24
-
25
-
26
-
27
-
28
-
29
-
30
-
31
-
32
-
33
-
34
-
35
-
36
-
37
-
38
-
39
-
40
-
41
-
42
-
43
-
44
-
45
-
46
-
47
-
48
-
49
-
50
-
51
-
52
-
53
-
54
-
55
-
56
-
57
-
58
-
59
-
60
-
61
-
62
-
63
-
64
-
65
-
66
-
67
-
68
-
69
-
70
-
71
-
72
-
73
-
74
-
75
-
76
-
77
-
78
-
79
-
80
-
81
-
82
-
83
-
84
-
85
-
86
-
87
-
88
-
89
-
90
-
91
-
92
-
93
-
94
-
95
-
96
-
97
-
98
-
99
-
100
-
101
-
102
-
103
-
104
-
105
-
106
-
107
-
108
-
109
-
110
-
111
-
112
-
113
-
114
-
115
-
116
-
117
-
118
-
119
-
120
-
121
-
122
-
123
-
124
-
125
-
126
-
127
-
128
-
129
-
130
-
131
-
132
-
133
-
134
-
135
-
136
-
137
-
138
-
139
-
140
-
141
-
142
-
143
-
144
-
145
-
146
-
147
-
148
-
149
-
150
-
151
-
152
-
153
-
154
-
155
-
156
-
157
-
158
-
159
-
160
-
161
-
162
-
163
-
164
-
165
-
 166
166 -
 167
167 -
 168
168 -
 169
169 -
 170
170 -
 171
171 -
 172
172 -
 173
173 -
 174
174 -
 175
175 -
 176
176 -
 177
177 -
 178
178 -
 179
179 -
 180
180 -
 181
181 -
 182
182 -
 183
183 -
 184
184 -
 185
185 -
 186
186 -
187
-
188
-
189
-
190
-
191
-
192
-
193
-
194
-
195
-
196
-
197
-
198
-
199
-
200
-
201
-
202
-
203
-
204
-
205
-
206
-
207
-
208
-
209
-
210
-
211
-
212
-
213
-
214
-
215
 |
 |

174 Lenovo Group Limited 2014/15 Annual Report
NOTES TO THE FINANCIAL STATEMENTS
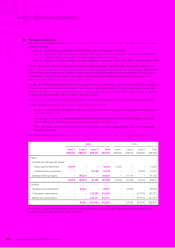
11 EMOLUMENTS OF DIRECTORS AND HIGHEST PAID INDIVIDUALS (continued)
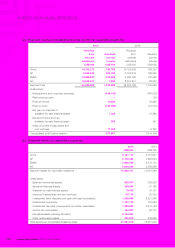
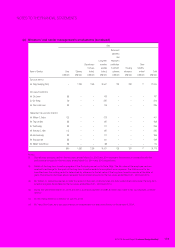
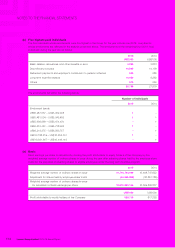
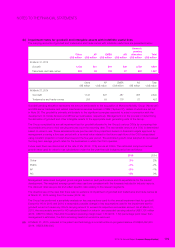
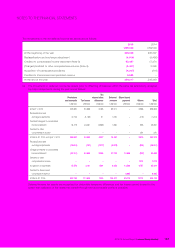
(b) Five highest paid individuals
The five individuals whose emoluments were the highest in the Group for the year include one (2014: one) director
whose emoluments are reflected in the analysis presented above. The emoluments of the remaining four (2014: four)
individuals during the year are as follows:
2015 2014
US$’000 US$’000
Basic salaries, allowances, and other benefits-in-kind 4,093 3,873
Discretionary bonuses 10,865 14,199
Retirement payments and employer’s contribution to pension schemes 625 285
Long-term incentive awards 10,630 9,262
Others 575 260
26,788 27,879
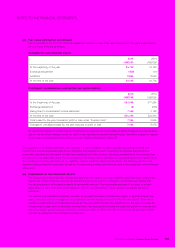
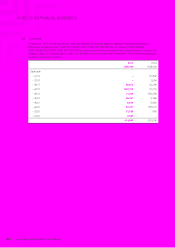
The emoluments fell within the following bands:
Number of individuals
2015 2014
Emolument bands
US$5,287,557 – US$5,352,038 1–
US$5,481,004 – US$5,545,485 11
US$5,609,969 – US$5,674,450 –1
US$5,674,451 – US$5,738,933 1–
US$6,319,275 – US$6,383,757 –1
US$10,188,219 – US$10,252,701 1–
US$10,381,667 – US$10,446,148 –1
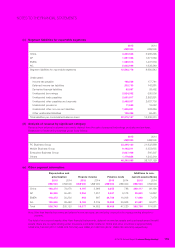
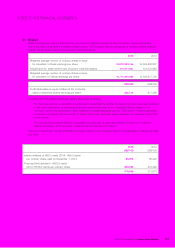
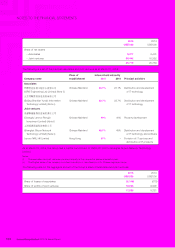
12 EARNINGS PER SHARE
(a) Basic
Basic earnings per share is calculated by dividing the profit attributable to equity holders of the Company by the
weighted average number of ordinary shares in issue during the year after adjusting shares held by the employee share
trusts for the purposes of awarding shares to eligible employees under the long term incentive program.
2015 2014
Weighted average number of ordinary shares in issue 10,714,763,044 10,408,747,622
Adjustment for shares held by employee share trusts (44,369,898) (38,861,785)
Weighted average number of ordinary shares in issue
for calculation of basic earnings per share 10,670,393,146 10,369,885,837
US$’000 US$’000
Profit attributable to equity holders of the Company 828,715 817,228