IBM 2004 Annual Report Download - page 95
Download and view the complete annual report
Please find page 95 of the 2004 IBM annual report below. You can navigate through the pages in the report by either clicking on the pages listed below, or by using the keyword search tool below to find specific information within the annual report.-
 1
1 -
2
-
3
-
4
-
5
-
6
-
7
-
8
-
9
-
10
-
11
-
12
-
13
-
14
-
15
-
16
-
17
-
18
-
19
-
20
-
21
-
22
-
23
-
24
-
25
-
26
-
27
-
28
-
29
-
30
-
31
-
32
-
33
-
34
-
35
-
36
-
37
-
38
-
39
-
40
-
41
-
42
-
43
-
44
-
45
-
46
-
47
-
48
-
49
-
50
-
51
-
52
-
53
-
54
-
55
-
56
-
57
-
58
-
59
-
60
-
61
-
62
-
63
-
64
-
65
-
66
-
67
-
68
-
69
-
70
-
71
-
72
-
73
-
74
-
75
-
76
-
77
-
78
-
79
-
80
-
81
-
82
-
83
-
84
-
 85
85 -
 86
86 -
 87
87 -
 88
88 -
 89
89 -
 90
90 -
 91
91 -
 92
92 -
 93
93 -
 94
94 -
 95
95 -
 96
96 -
 97
97 -
 98
98 -
 99
99 -
 100
100
 |
 |

93
ibm annual report 2004
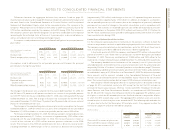
Selected Quarterly Data
(Dollars in millions
except per share amounts and stock prices)
First Second Third Fourth Full
2004:Quarter Quarter Quarter Quarter Year
Revenue $«22,175* $«23,098* $«23,349* $«27,671 $«96,293*
Gross profit 8,009 8,525 8,646 10,852 36,032
Income from continuing
operations 1,603 1,990 1,800 3,055 8,448
Loss from discontinued
operations (1) (2) — (15) (18)
Net income 1,602 1,988 1,800 3,040 8,430
Earnings/(loss) per share of
common stock:
Assuming dilution:
Continuing operations 0.93 1.16 1.06 1.81 4.94**
Discontinued operations — — — (0.01) (0.01)
Total 0.93 1.16 1.06 1.80 4.93**
Basic:
Continuing operations 0.95 1.18 1.08 1.84 5.04**
Discontinued operations — — — (0.01) (0.01)
Total 0.95 1.18 1.08 1.83 5.03**
Dividends per share of
common stock 0.16 0.18 0.18 0.18 0.70
Stock prices++:
High $«100.43 $«««94.55 $«««88.44 $«««99.00
Low 89.01 85.12 81.90 84.29
(Dollars in millions
except per share amounts and stock prices)
First Second Third Fourth Full
2003:Quarter Quarter Quarter Quarter Year
Revenue $«20,065 $«21,631 $«21,522 $«25,913 $«89,131
Gross profit 7,233 7,998 7,812 9,975 33,018
Income from continuing
operations 1,387 1,725 1,785 2,716 7,613
Loss from discontinued
operations (3) (20) — (7) (30)
Net income 1,384 1,705 1,785 2,709 7,583
Earnings/(loss) per share of
common stock:
Assuming dilution:
Continuing operations 0.79 0.98 1.02 1.56 4.34**
Discontinued operations — (0.01) — — (0.02) **
Total 0.79 0.97 1.02 1.55+ 4.32**
Basic:
Continuing operations 0.80 1.00 1.04 1.59 4.42**
Discontinued operations — (0.01) — — (0.02) **
Total 0.80 0.99 1.04 1.59 4.40**
Dividends per share of
common stock 0.15 0.16 0.16 0.16 0.63
Stock prices++:
High $«««88.95 $«««90.40 $«««93.47 $«««94.54
Low 73.17 78.12 78.73 87.53
*See page12, “Subsequent Event” for additional information regarding 2004 quarterly revenue.
** Earnings Per Share (EPS) in each quarter is computed using the weighted-average number of shares outstanding dur-
ing that quarter while EPS for the full year is computed using the weighted-average number of shares outstanding
during the year. Thus, the sum of the four quarters’ EPS does not equal the full-year EPS.
+Does not total due to rounding.
++ The stock prices reflect the high and low prices for IBM’s common stock on the New York Stock Exchange composite
tape for the last two years.